OnlyFans Analytics and Spending Statistics: 2025 Data Report for Marketers
The right OnlyFans promotion strategy can do more than just increase earnings, it can help optimize budget use and ensure a more efficient division of workload between the model and the marketer. But how exactly does it achieve that? This report explores the answer by diving into comprehensive OnlyFans analytics and essential OnlyFans statistics, sourced from an exclusive dataset of 1 million fans who signed up via OnlyTraffic.
We’re releasing this exclusive 2025 data report to equip marketers with actionable OnlyFans marketing insights. Within it, you’ll find key OnlyFans statistics covering traffic source performance, ROI, OnlyFans fan behavior on the model’s page, refund rates, subscription renewals, and other critical metrics.
This in-depth analysis of OnlyFans fan spending habits in 2025 reveals the patterns and trends that matter most. By the end of this article, we’ll distill the insights into a clear, practical summary, showing you exactly how to leverage these OnlyFans analytics for greater success.
Key OnlyFans Statistics: An Overview of 1M Fan Transactions
There is data with fresh onlyfans statistics on the internet. To gain deeper, long-term insights into OnlyFans statistics, we analyzed data from 1 million fans who engaged with our platform. This robust sample size allows us to identify average performance indicators and better understand OnlyFans fan behavior across various transaction types. Here’s what the date revealed:
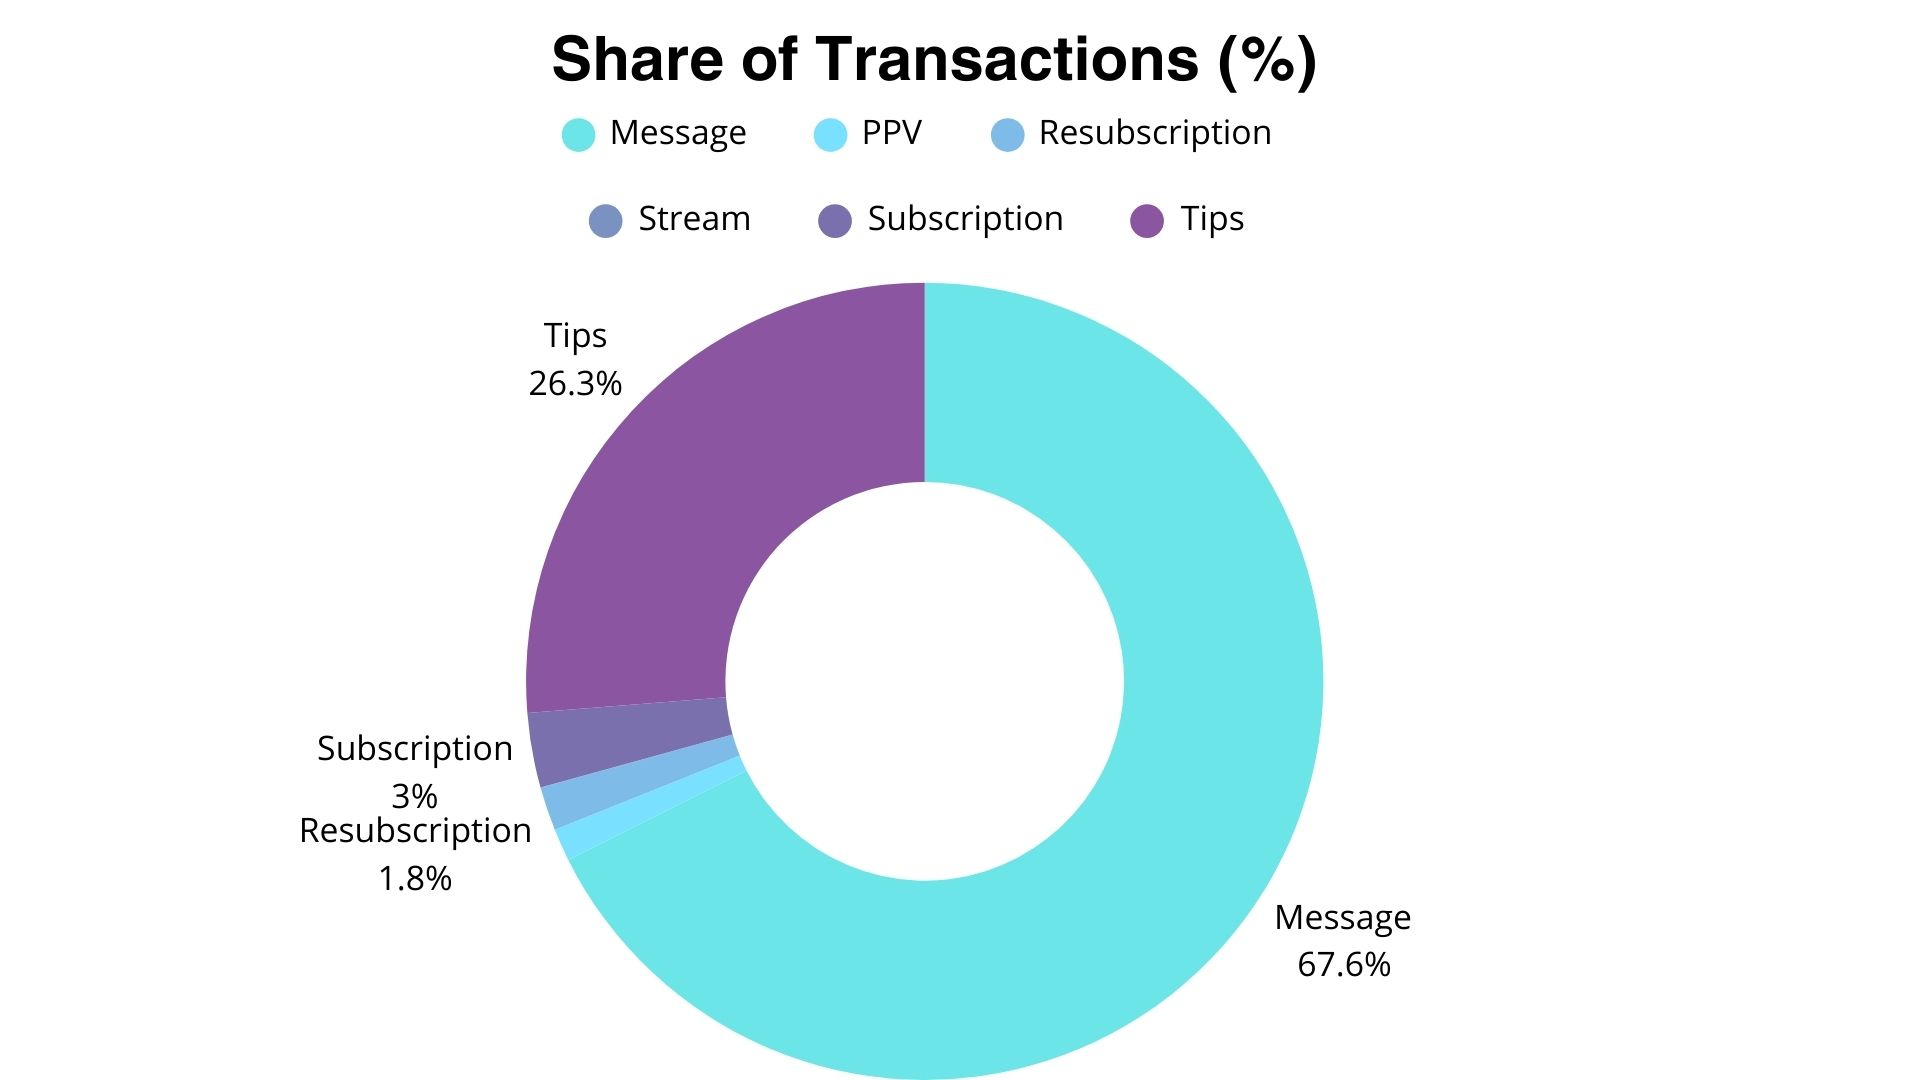
- Among all transaction types, Messages came first with 1,383,252 transactions.
- Tips followed with 537,386.
- Subscription payments reached 61,957, while renewals accounted for 36,266.
- Paid post purchases (PPV content) totaled 26,884.
- Streams had the fewest transactions, with only 200.
TThe total amount of all transactions was $2,045,944. A key insight from our OnlyFans revenue breakdown reveals that $412,823 (20.2%) came from just 100 fans, a mere 0.01% of the total user base. In contrast, the remaining 999,900 subscribers were responsible for the other 79.8% of the revenue.
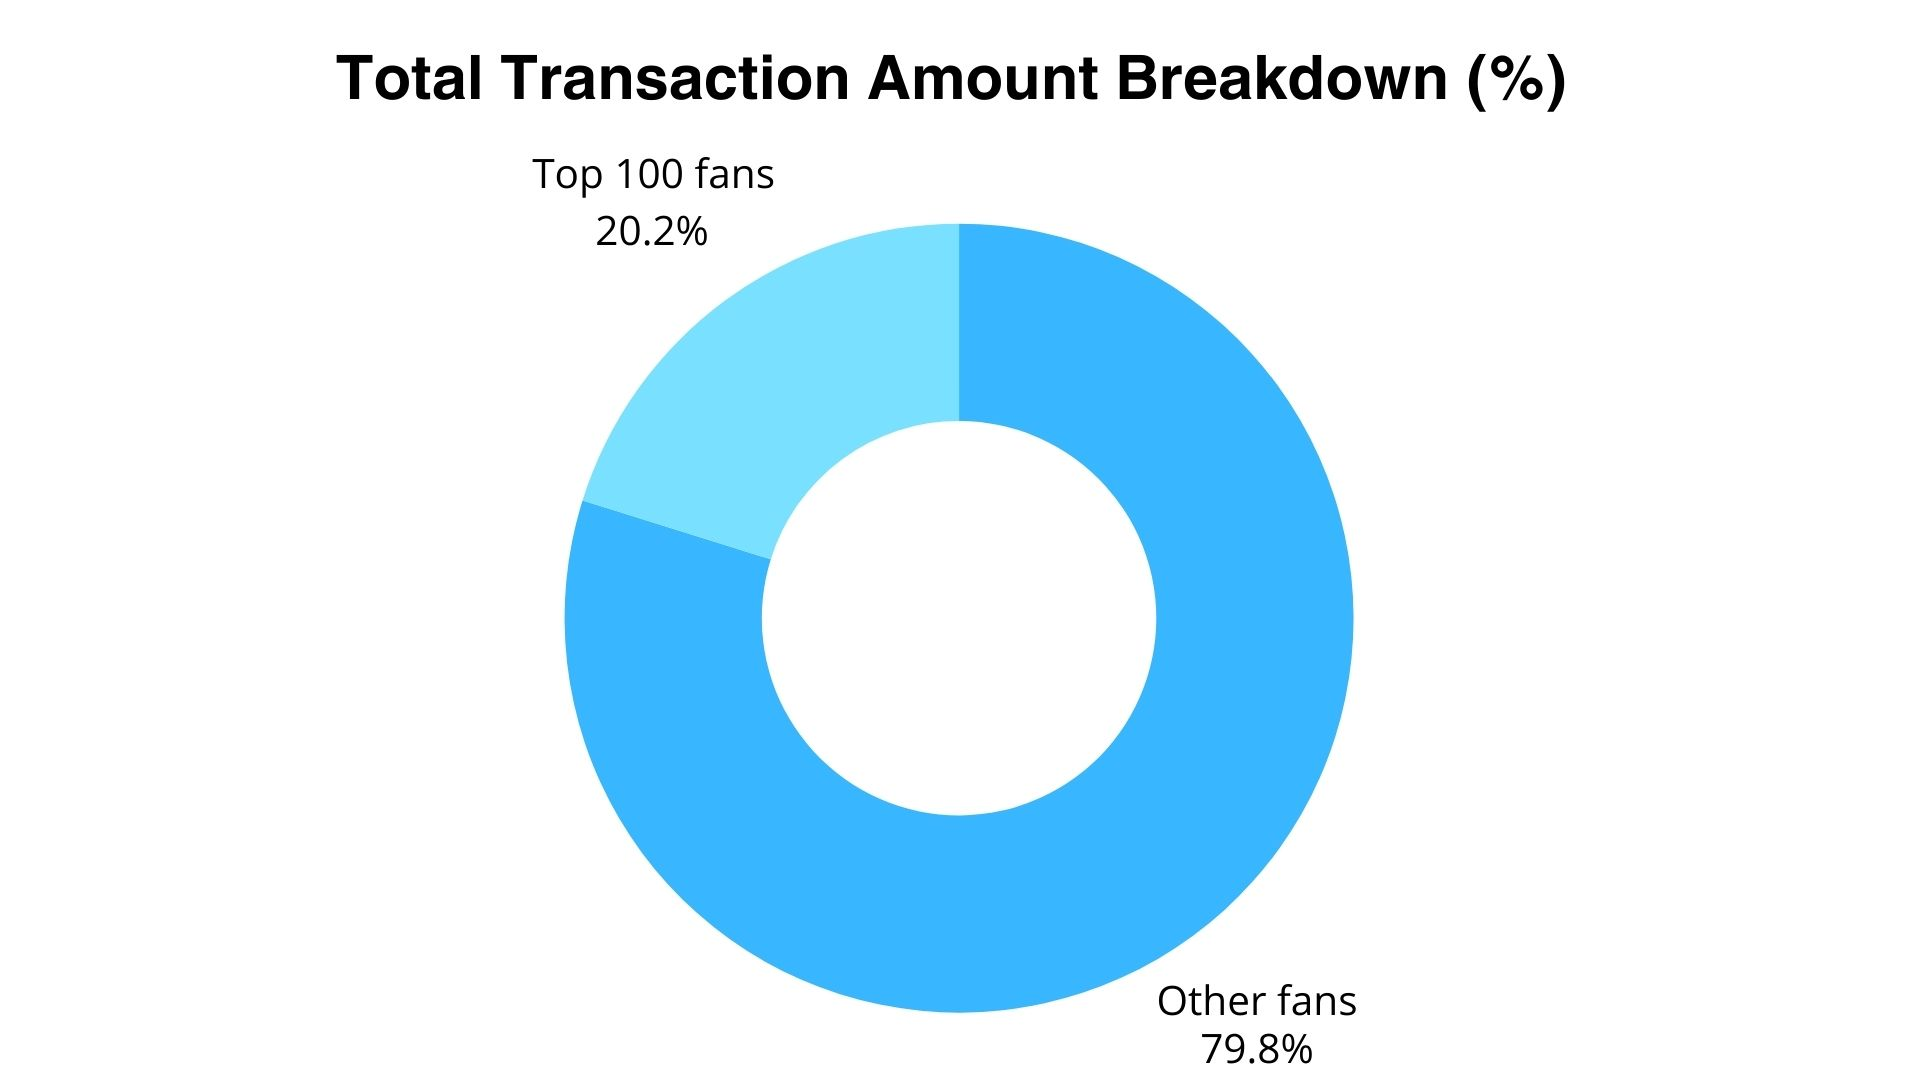
This highlights the critical role of “whales” on OnlyFans: each of these top 100 users spent between $1,397 and $59,030. Interestingly, even someone who spent just $1,500 over time qualifies as a whale and joins this exclusive 0.01%, showing that such users deserve special attention.
Refunds totaled $21,339, representing just 1.03% of the total revenue, a relatively small figure.
The contribution of chatters is also worth noting. Since they help foster long-term relationships with subscribers, their work has a direct impact on a model’s income. This relationship-building is a defining characteristic of OnlyFans fan behavior.
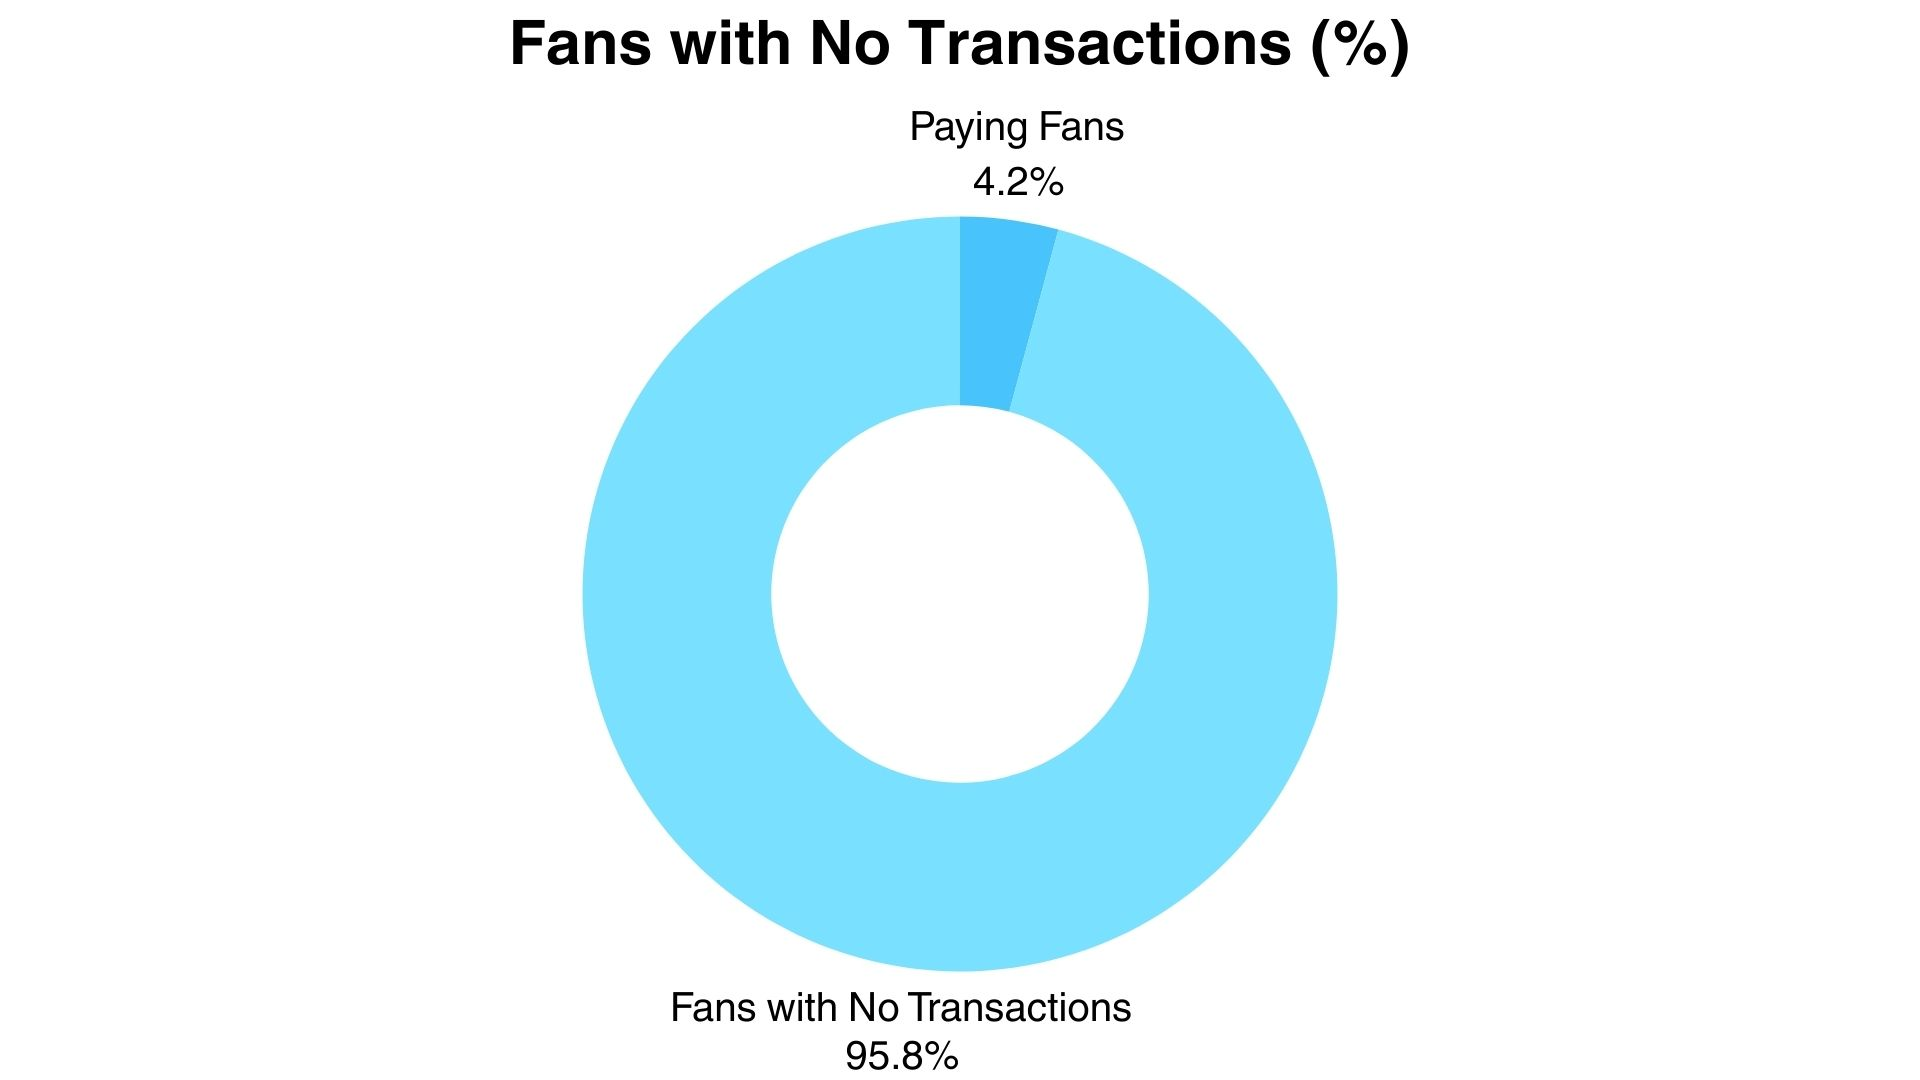
Among the platform’s one million fans, only 4.2% made a transaction, while a staggering 95.8% didn’t make a single purchase. We’ll dive deeper into how these numbers change based on OnlyFans traffic source analysis in the next section.
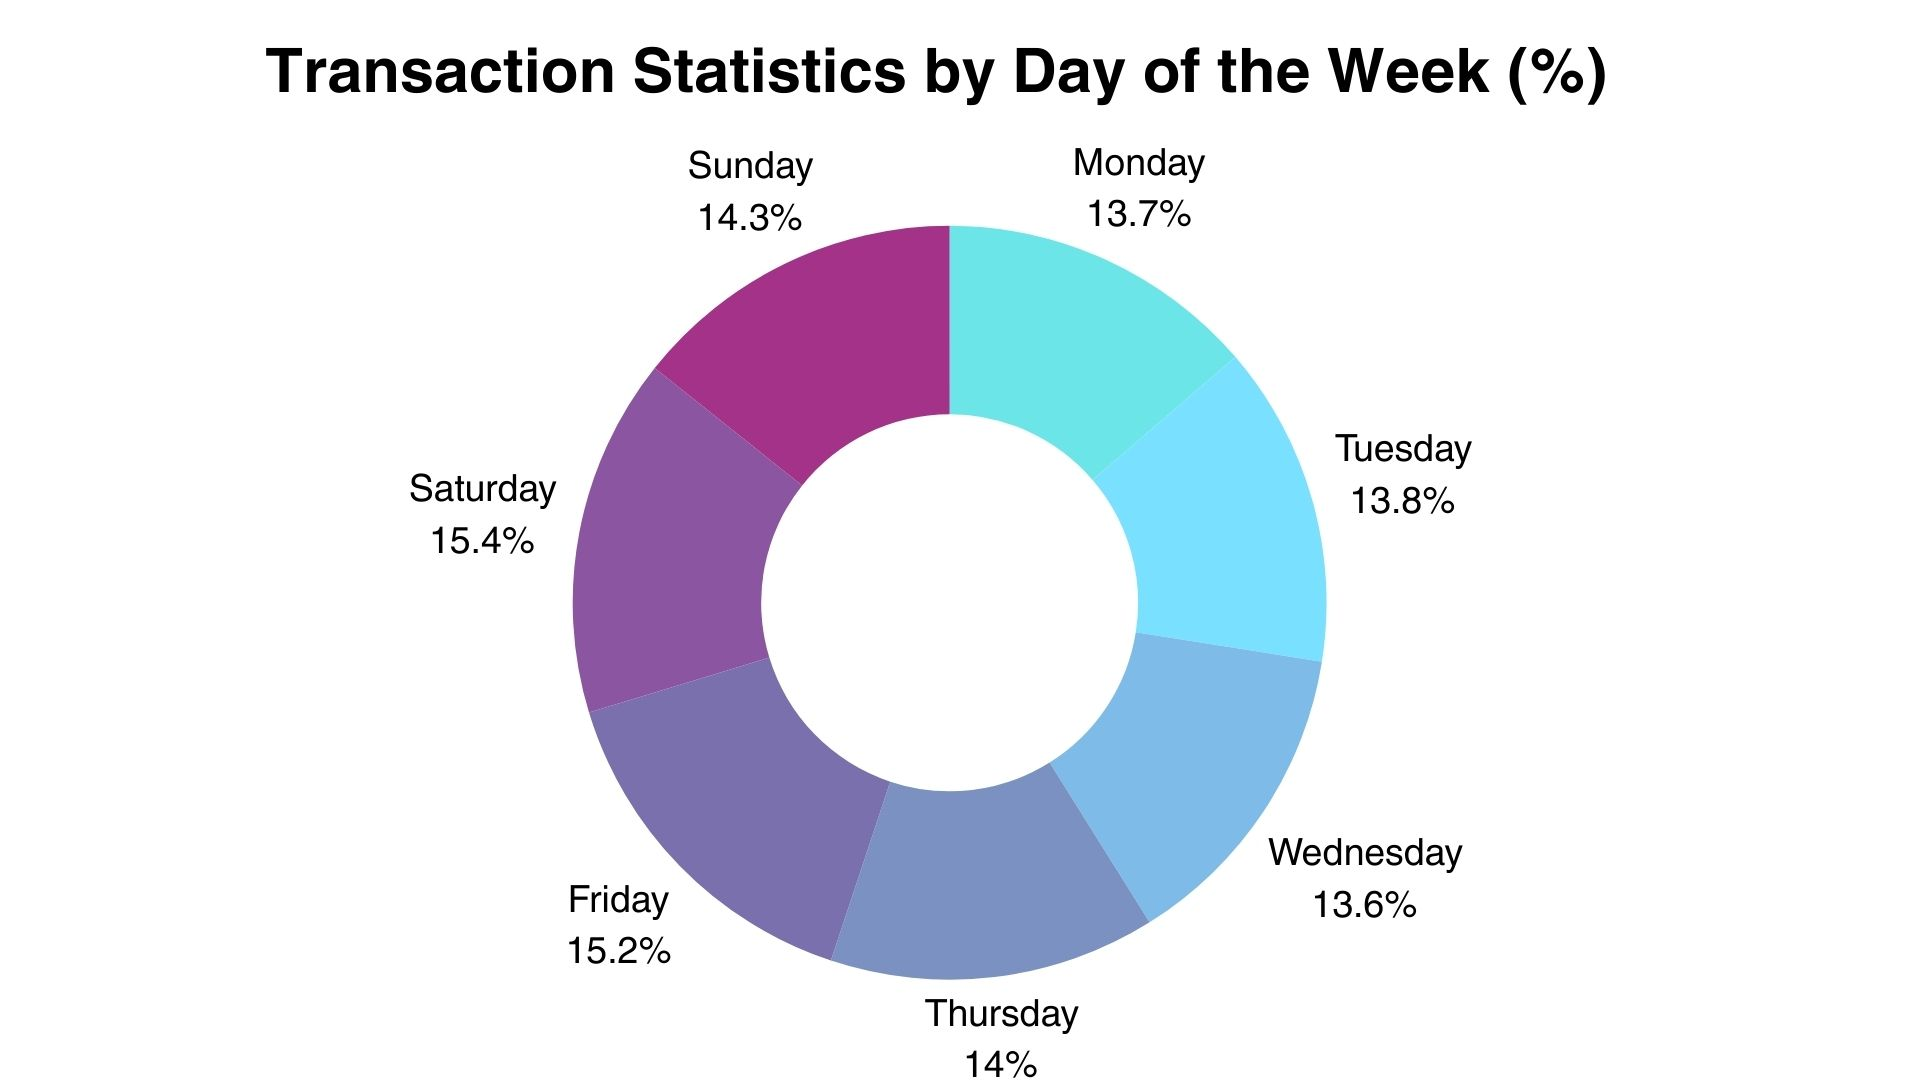
In terms of timing, transactions were fairly evenly distributed throughout the week, with no dramatic spikes or drops. However, Saturdays had the highest share at 15.4%, while Wednesdays had the lowest at 13.6%. The most active days were Friday, Saturday, and Sunday, whereas Monday, Tuesday, and Wednesday were less active. This temporal OnlyFans statistic can help in planning the timing of promotions more effectively.
Section Summary: Key Statistics
- Messages are the most common transaction type.
- A tiny fraction of fans (0.01%, "whales") contribute over 20% of total revenue.
- Only 4.2% of fans make any transaction.
- Weekends see slightly higher transaction activity.
- These initial OnlyFans statistics highlight the importance of targeted engagement.
OnlyFans Traffic Sources: ARPU and Average Cost per Subscriber Analysis
To better understand which OnlyFans traffic sources perform best, we analyzed OnlyFans statistics by separating data into free and paid pages. This segmentation offers valuable OnlyFans marketing insights into what drives fan growth for each content model.
Free Pages: Unpacking OnlyFans Analytics
When looking at where subscribers to free pages came from, the top-performing platforms were:
- 147,718 came from Twitter
- 143,323 from Google
- Reddit contributed 57,979
- OnlyFans GG Promo with 42,748
- Telegram with 41,739
- Instagram brought in 32,511
- Creator Traffic accounted for 16,015
- Tumblr generated 14,562
- TikTok brought in 13,154
- Adult forums added 10,614
- Snapchat contributed 10,538.
Additional OnlyFans traffic sources are shown in the chart below

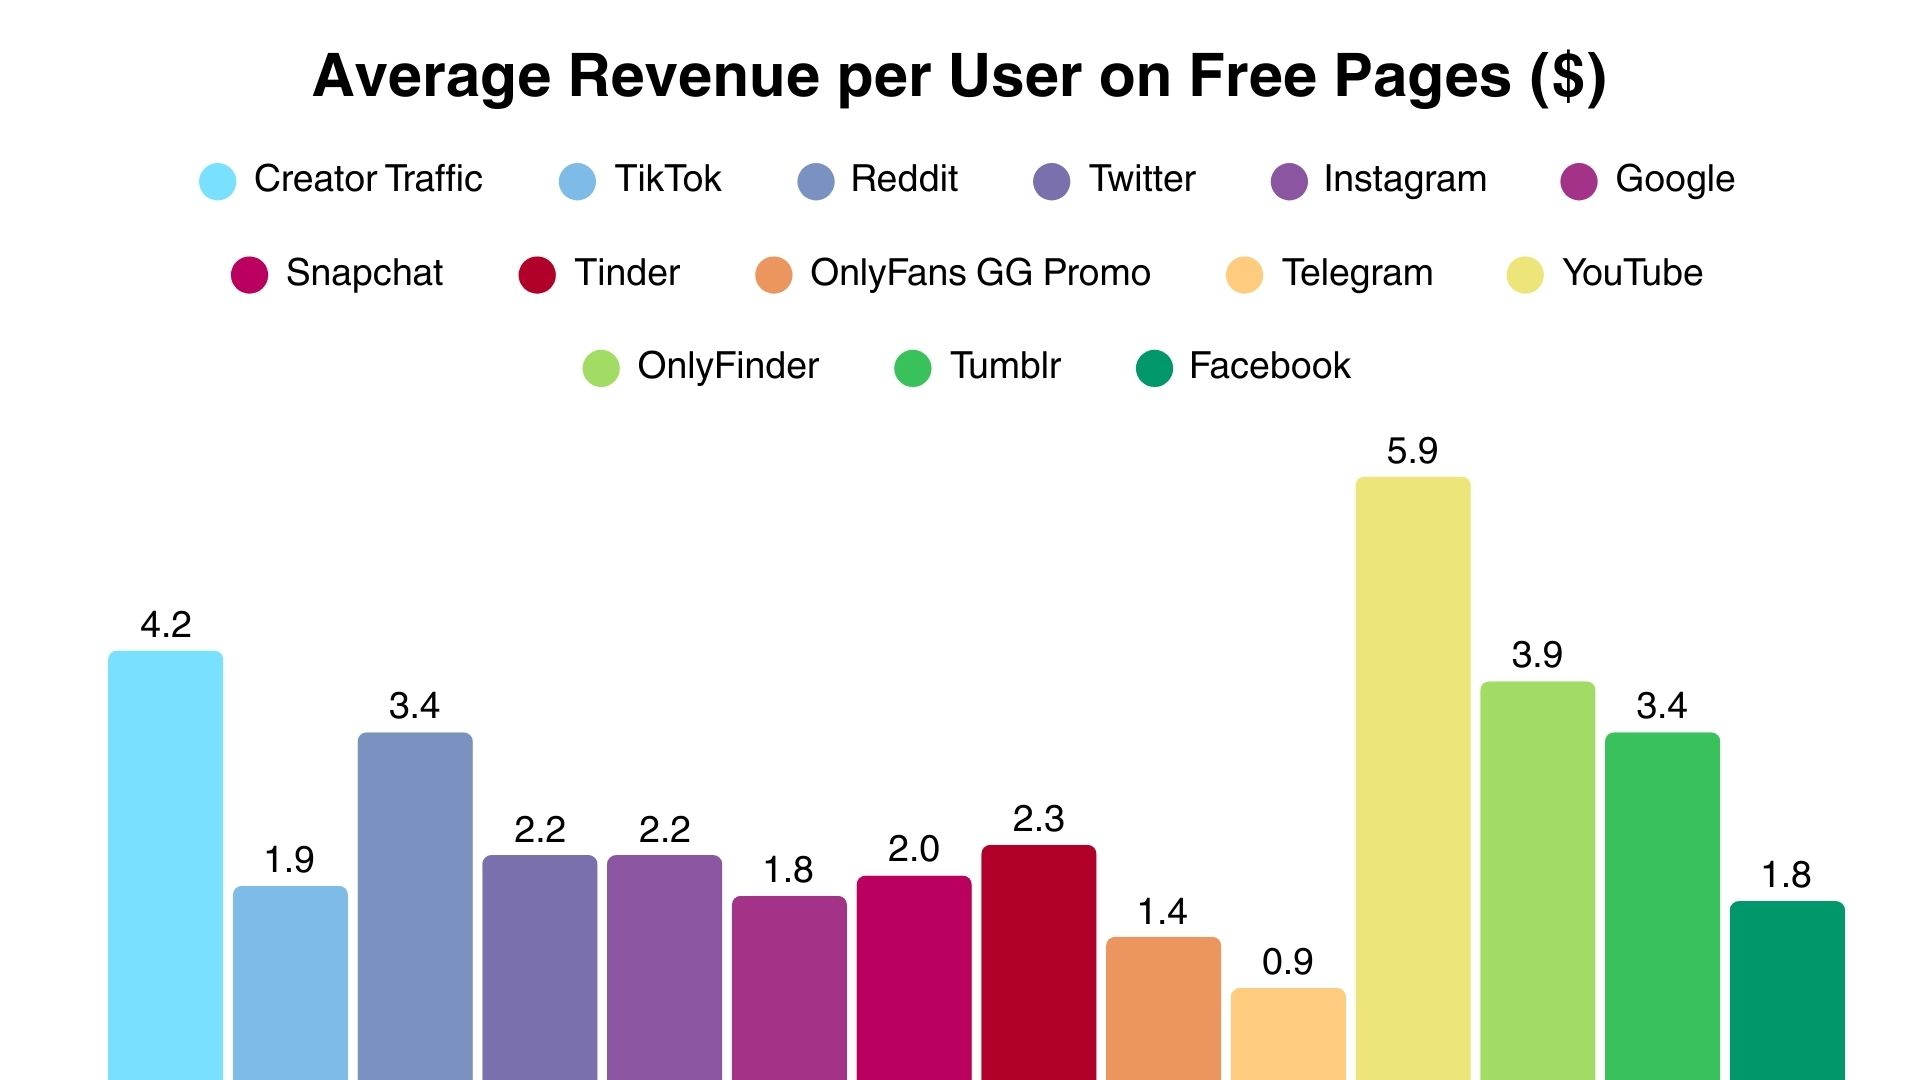
One of the key metrics for models and marketers is ARPU (Average Revenue Per User). We gathered data from free pages to see how this metric varies across different OnlyFans traffic sources. This OnlyFans analytics is vital.
- YouTube had the highest ARPU at $5.9.
- Creator Traffic at $4.2.
- OnlyFinder came in third with $3.9.
- Reddit and Tumblr were tied at $3.4.
- The lowest ARPU was seen on Telegram, at just $0.9
Section Summary: Free Pages Traffic
- Twitter and Google are top sources for fan volume on free pages.
- YouTube shows the highest ARPU for free pages, despite lower volume.
- Understanding ARPU per source is key to optimizing OnlyFans traffic sources.
Paid Pages: Deeper Dive into OnlyFans Statistics
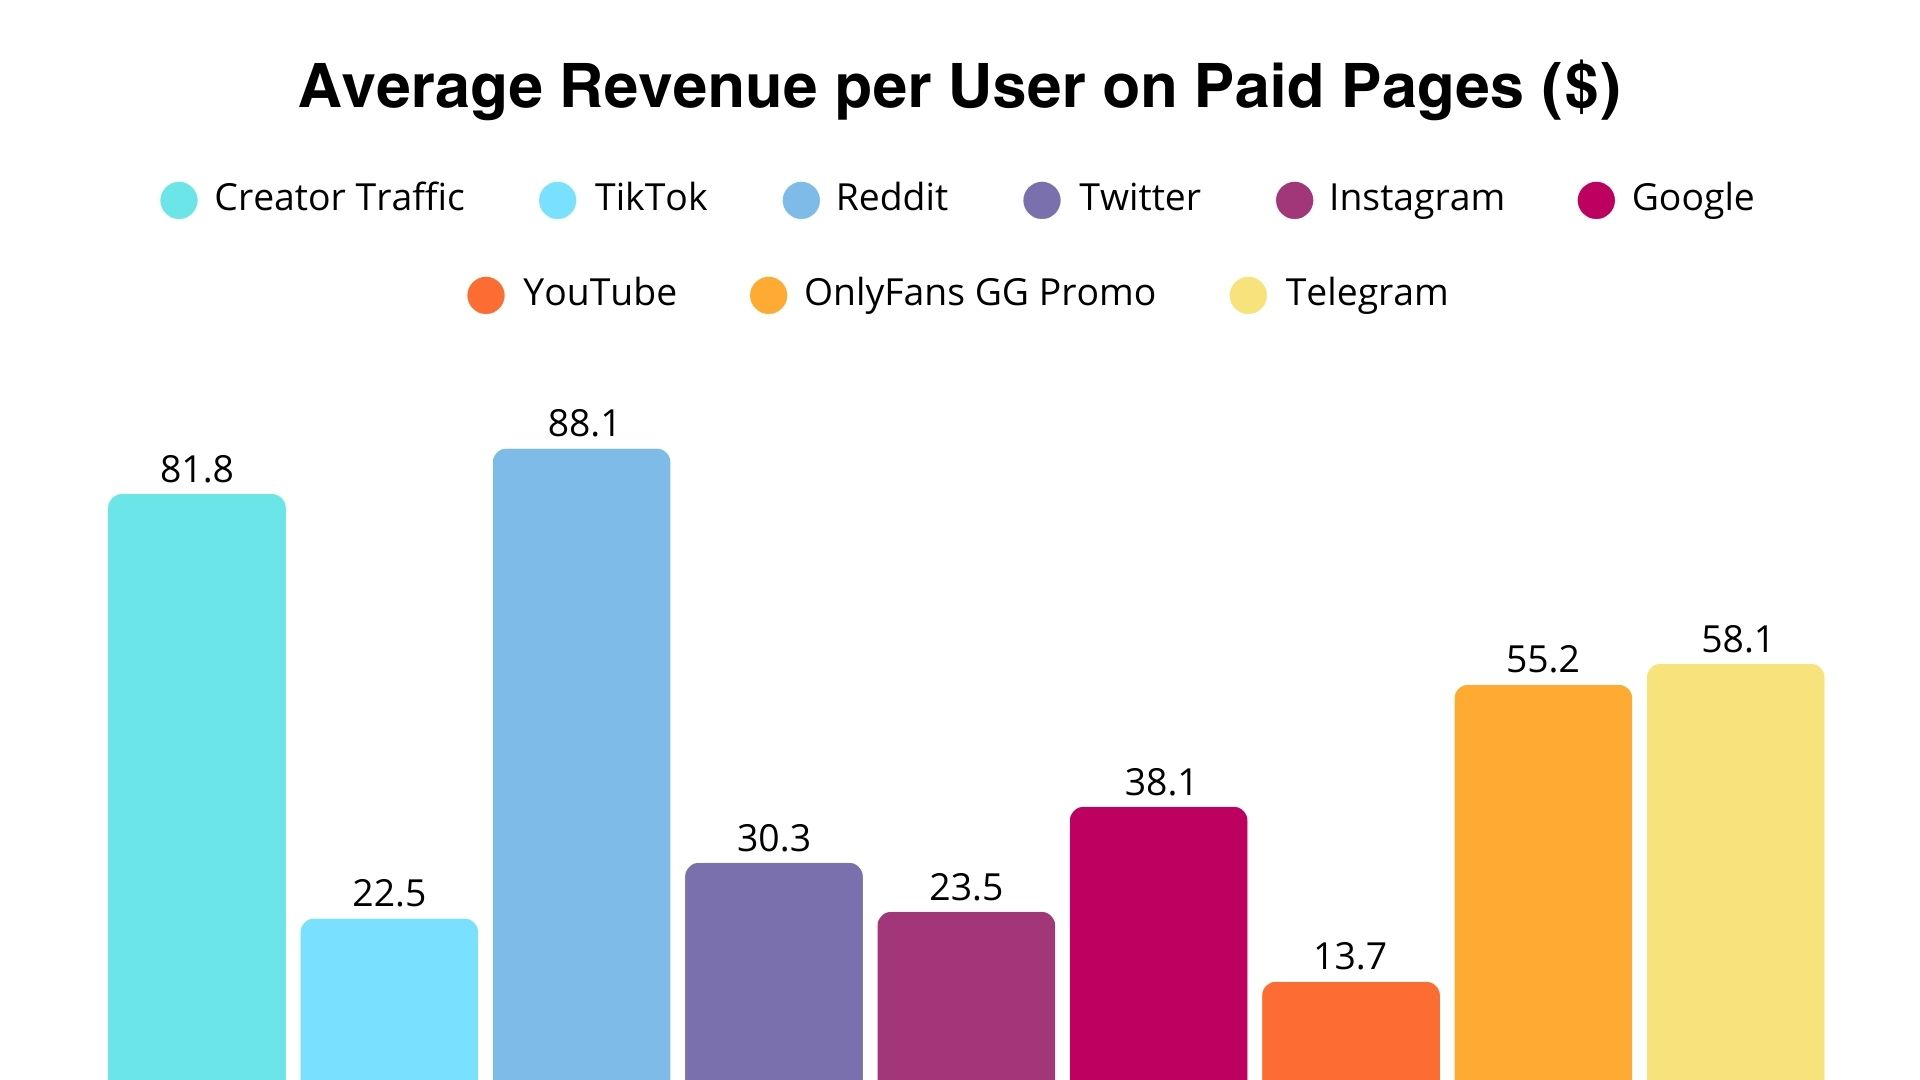
To better understand user behavior on paid pages, we calculated the average ARPU using only data from fans who actually paid for a subscription. This approach avoids skewing the OnlyFans statistics with the effects of discounts and promotions, offering a more accurate view of the OnlyFans revenue breakdown by source.
- Reddit led with the highest ARPU, averaging $88.1 per paid subscriber.
- Creator Traffic came in second at $81.8.
- TikTok performed below average with $22.5, nearly identical to Instagram at $23.5.
- YouTube recorded the lowest ARPU at $13.7.
These insights suggest that platforms like Reddit can drive high-value subscribers to paid pages, while TikTok may not be as effective for monetization. Such OnlyFans analytics are essential when refining your paid page strategies.
It’s also important to consider that these figures can vary based on the content and structure of the creator’s page. For example, pages cluttered with promo posts or excessive SFS (Shoutouts for Shoutouts) can significantly reduce ARPU, ROI, and other key OnlyFans statistics.
Average Cost per Subscriber (CPL) and Percentage of Fans with No Transactions: What is the typical cost per subscriber on OnlyFans and which sources have fewer non-paying fans?
We also analyzed the percentage of fans with no transactions across all page types, broken down by OnlyFans traffic source. The lower the percentage on the chart, the better. For example, the most effective source was TikTok, with only 77% of fans not making a transaction. The highest percentages were seen in Telegram and Creator Traffic, both at 98%. Analyzing how to analyze OnlyFans data like this helps refine ad spe

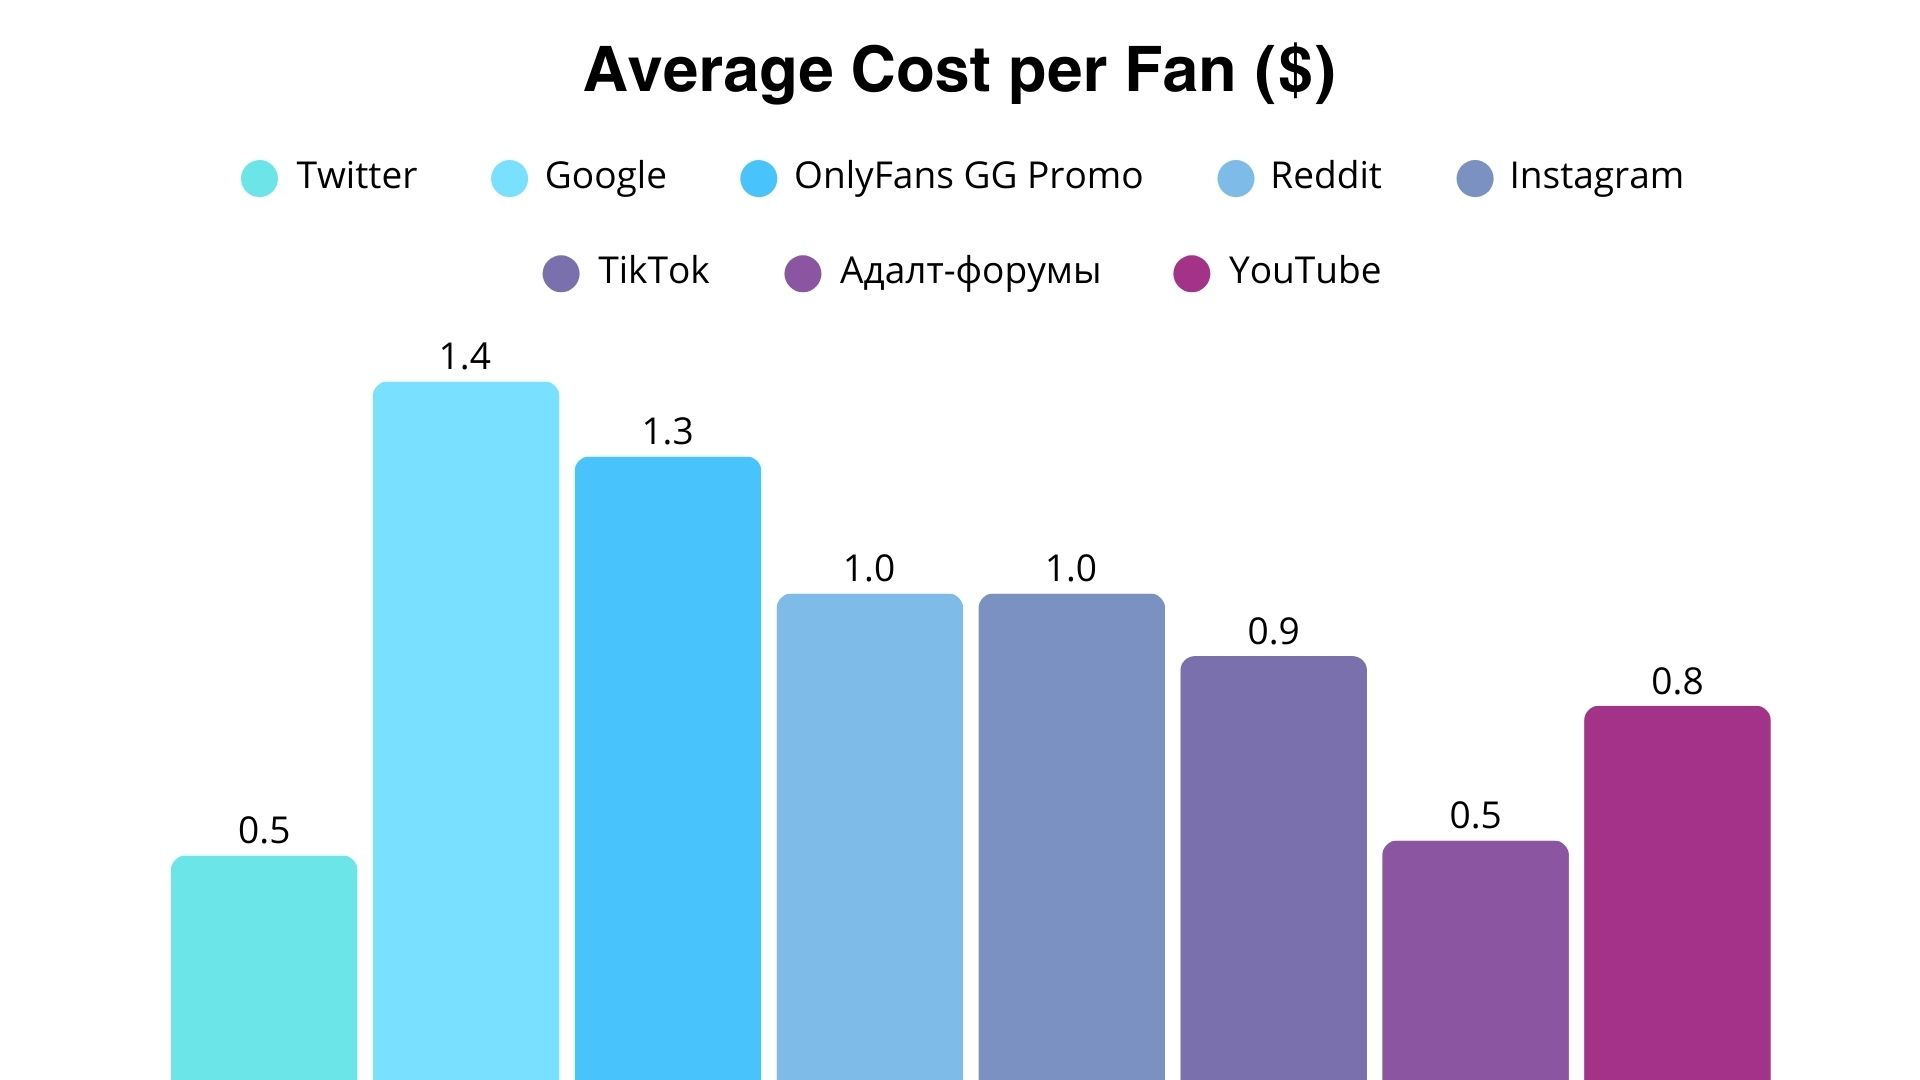
In addition to RevShare, OnlyTraffic also offers the option to buy fans through the CPL model.
- On average, a fan from Twitter cost $0.50.
- Google averaged $1.40 per fan.
- OnlyFans GG Promo came in at $1.30.
- Reddit and Instagram both averaged $1.00.
- TikTok was slightly lower at $0.90.
- Adult forums matched Twitter at $0.50.
- YouTube averaged $0.
Section Summary: Paid Pages & CPL
- Reddit leads in ARPU for paid subscribers.
- TikTok has a lower percentage of non-transacting fans but lower ARPU on paid pages.
- CPL varies significantly by source, with Twitter and adult forums being the cheapest.
- These OnlyFans statistics help in balancing acquisition cost with revenue potential.
OnlyFans Fan Behavior and Lifetime on a Model’s Page: LTV and Average Lifespan
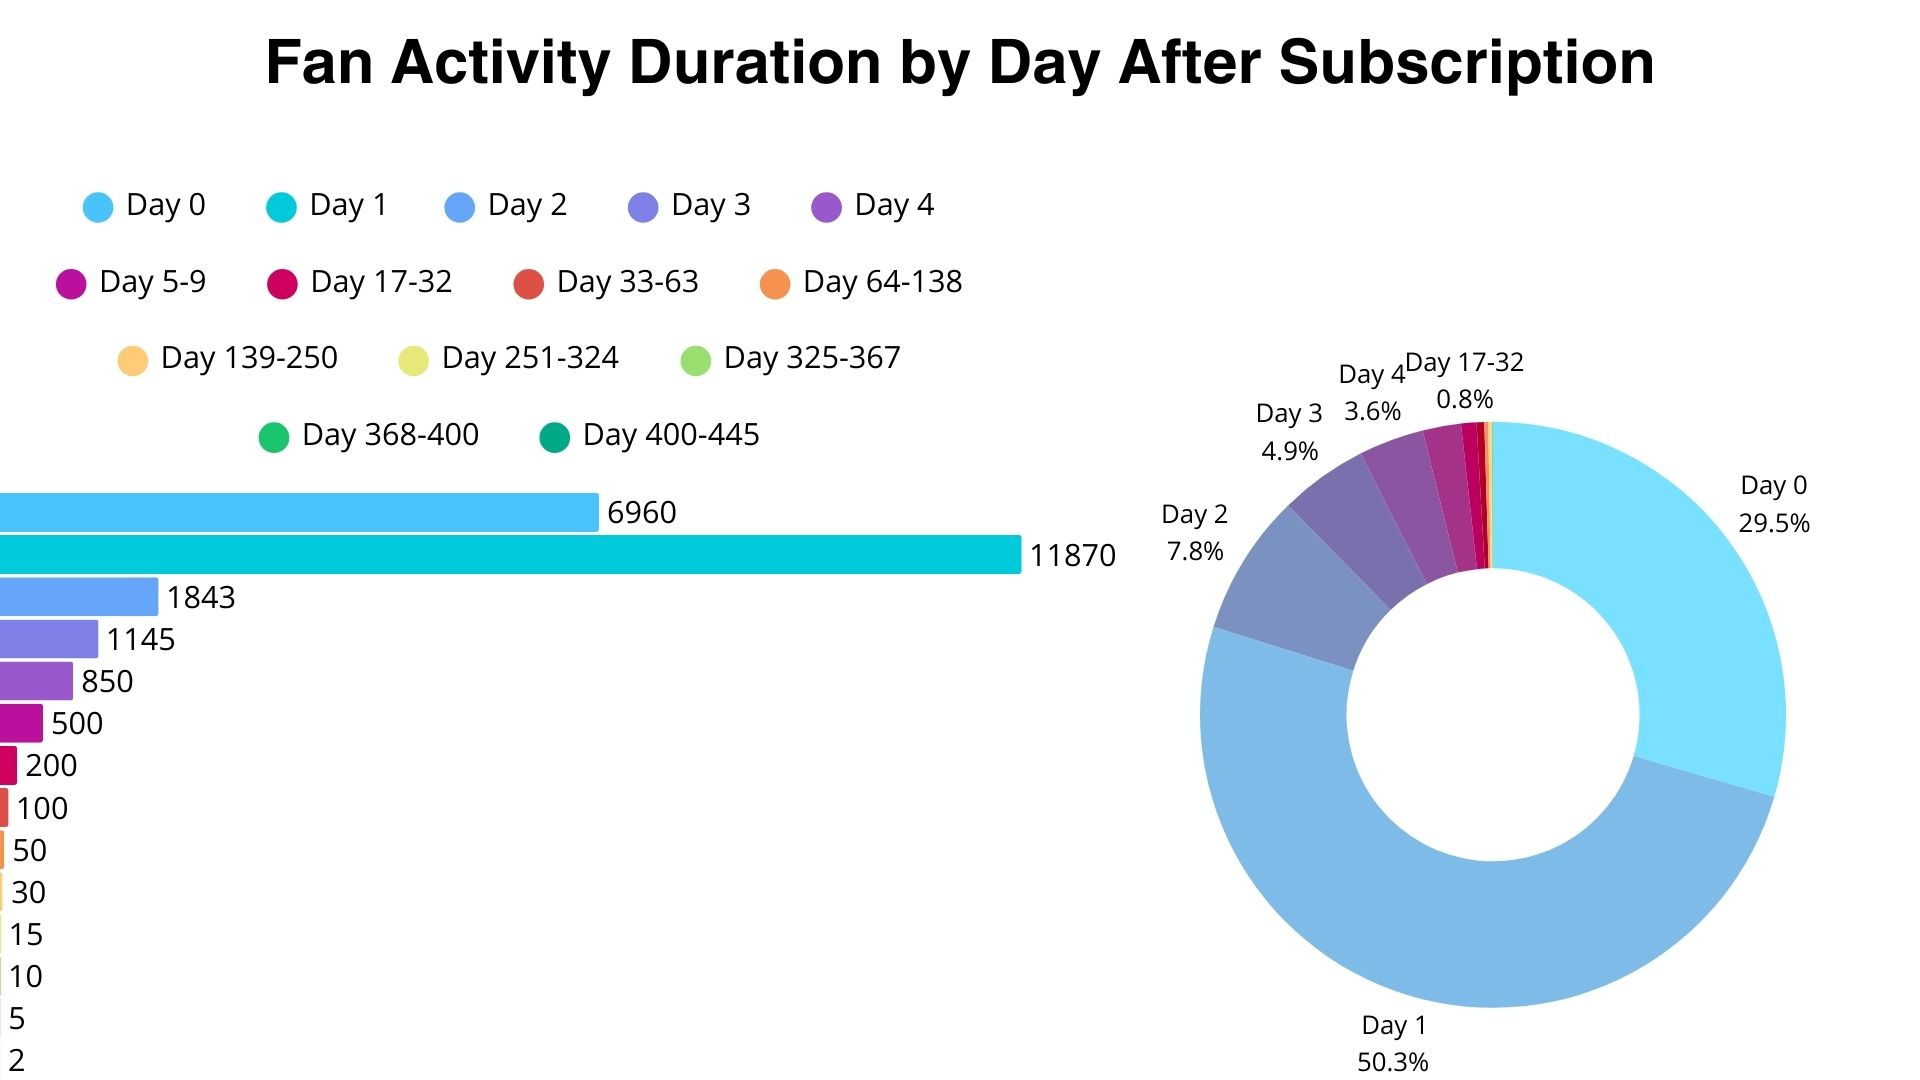
We analyzed 30,000 users who made a transaction to identify key OnlyFans fan behavior metrics on a model’s page.
- Most fans stopped engaging after the second day — 50.3%, or 11,870 users.
- The second largest group consisted of those who made a purchase on the day they subscribed and then disappeared — 29.5%, or 6,960 fans.
- Less than 5% stayed active for more than 10 days.
- The average fan lifespan on a model’s page was 44.85 days. This OnlyFans fan behavior data is critical.
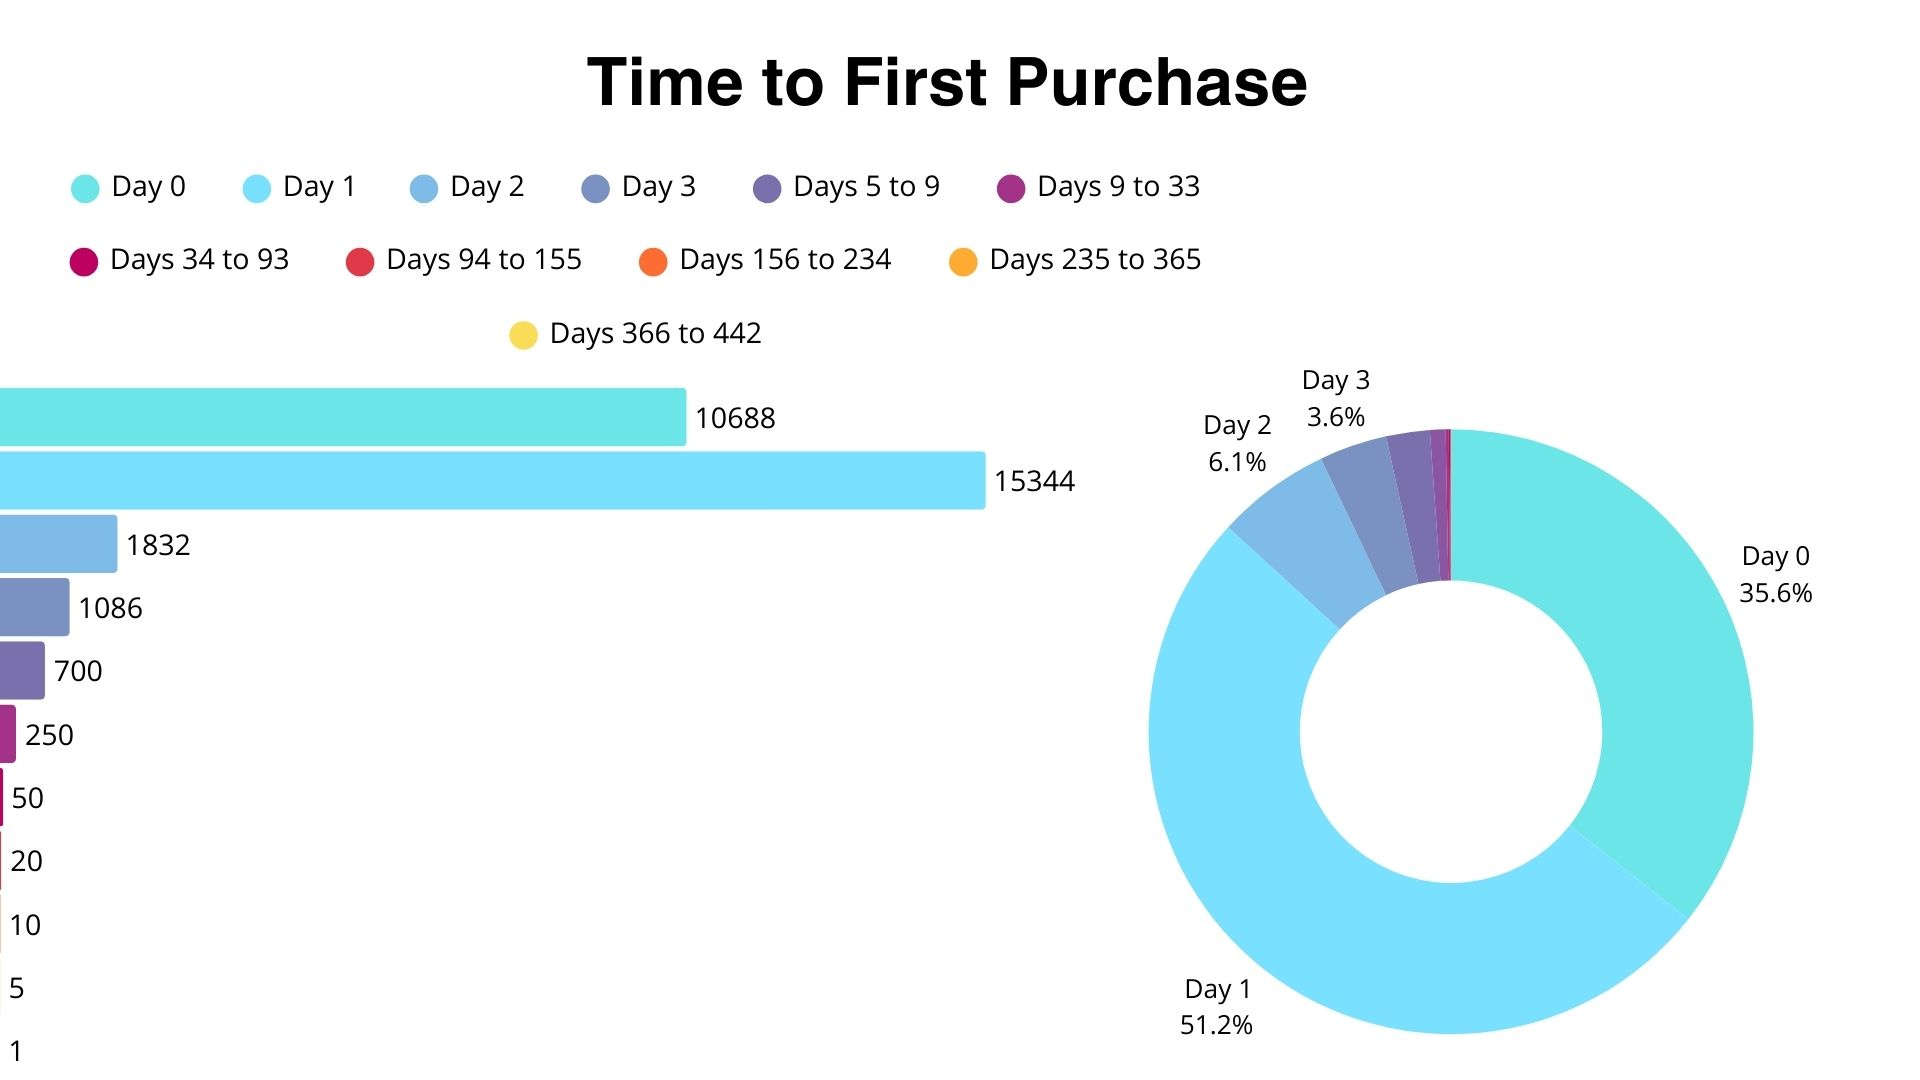
Now let’s take a look at the time between subscription and the first purchase. Understanding OnlyFans fan spending habits 2025 starts here.
- On the first day, 35.6% of users — or 10,688 fans — made a purchase.
- But more often, purchases happened on the second day: 52.2%, or 15,344 fans.
- Interestingly, some fans didn’t make their first purchase until more than 400 days after subscribing, though they made up less than 1% of the total.
On paid pages, fans renewed their OnlyFans subscription stats in 18.4% of cases.
Section Summary: Fan Behavior & Lifetime
- Fan engagement drops sharply after two days.
- Average fan lifespan is ~45 days.
- Most first purchases occur by the second day.
- Subscription renewal rate on paid pages is 18.4%.
- These OnlyFans analytics on OnlyFans fan behavior underscore the need for rapid engagement.
OnlyFans Funnel Performance: CTR, ROMI, and Other Metrics
Let’s move on to OnlyFans funnel performance analysis and take a look at CTR and OnlyFans conversion rates by traffic source, the cost per conversation, and the return on marketing investment (ROMI). This is where OnlyFans analytics truly shine.
CTR: A Metric of Ad Performance and Audience Interest
The CTR metric shows how willing users from different sources are to subscribe to a page. Simply put, it reflects how often a click turns into a subscription. This helps us better understand the audience, their interests, and their needs. For this analysis of OnlyFans statistics, we used data only from models’ free pages.
- OnlyFinder showed the highest CTR at 52.13%.
- Followed by Creator Traffic and OnlyFans GG Promo.
- The lowest CTRs were recorded for PopUnder at 0.38% and PreRoll at 0.25%.
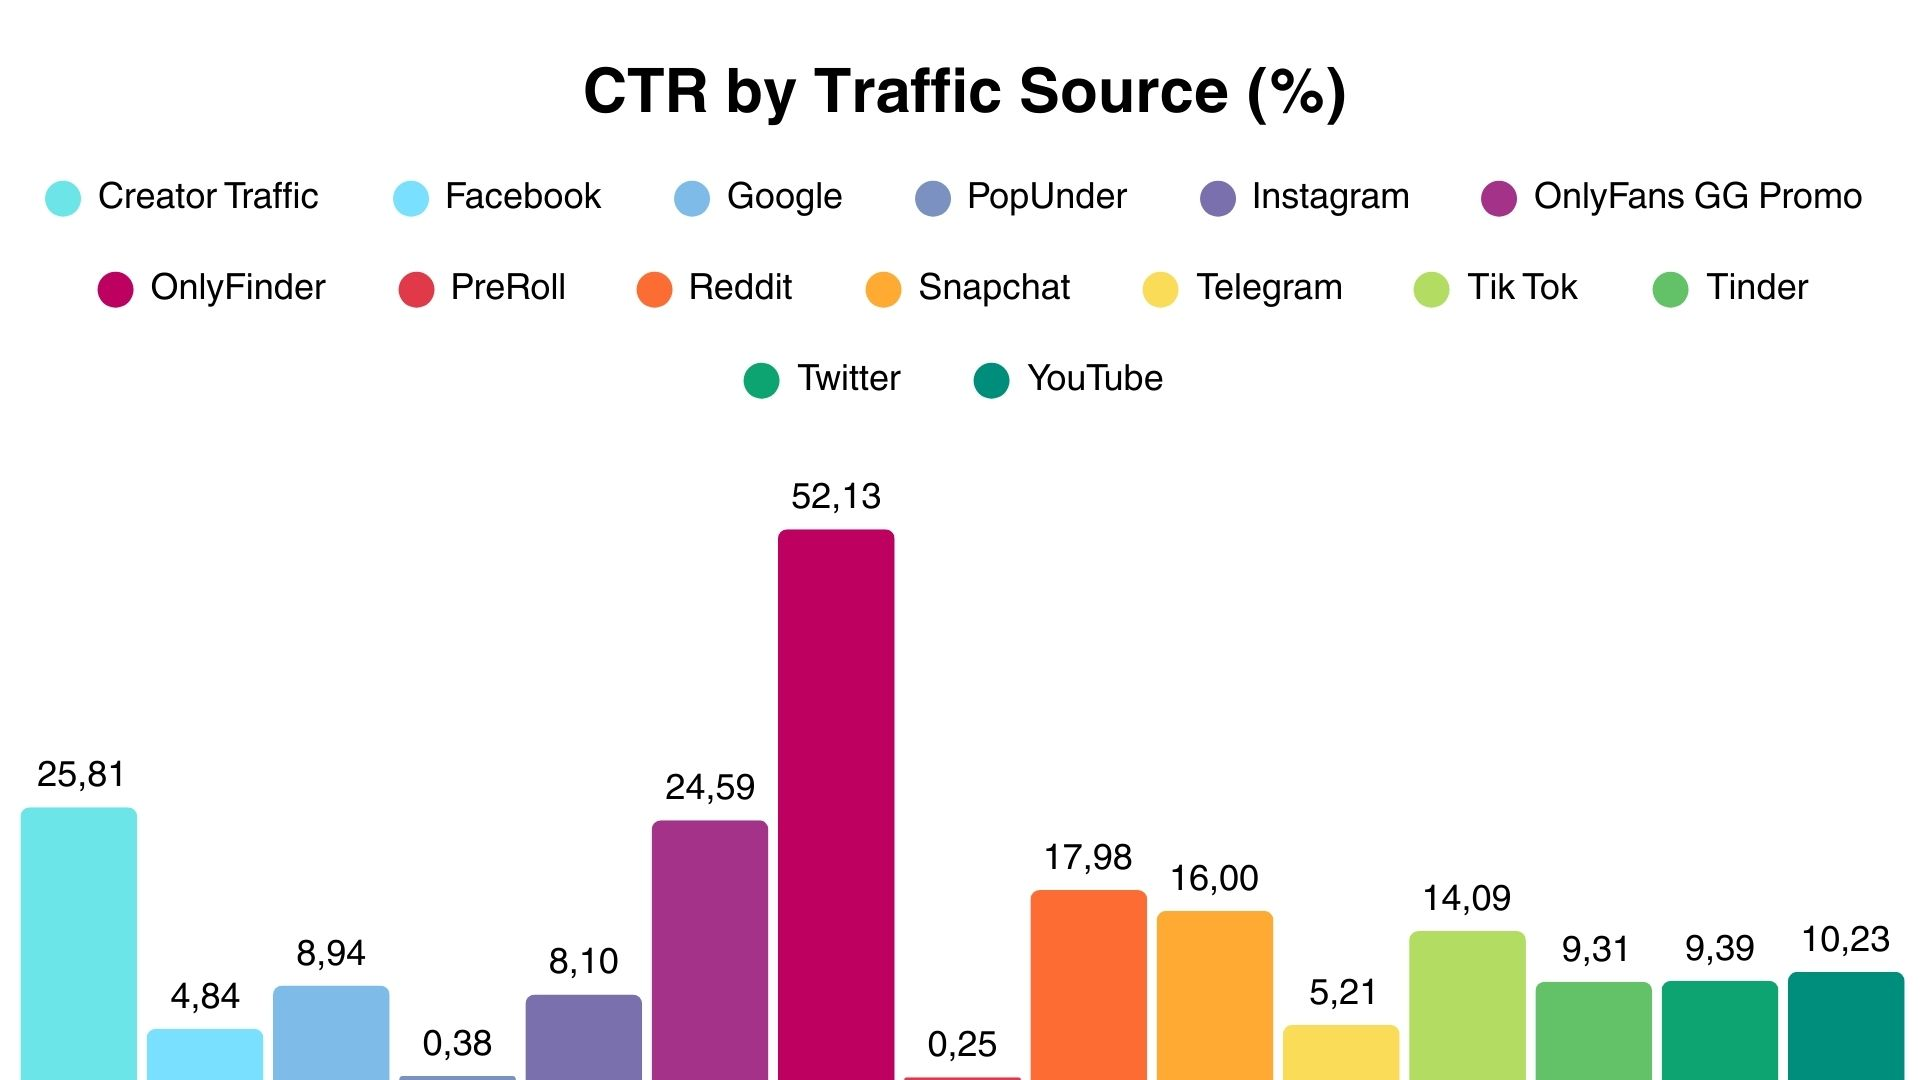
CTR often depends on whether the audience from a given source already has an OnlyFans account. For example, OnlyFinder is a directory site specifically for finding models, meaning the traffic is highly targeted which naturally results in a higher CTR. These OnlyFans marketing insights are valuable.
OnlyFans Sales Funnel Analysis: From Subscription to Purchase
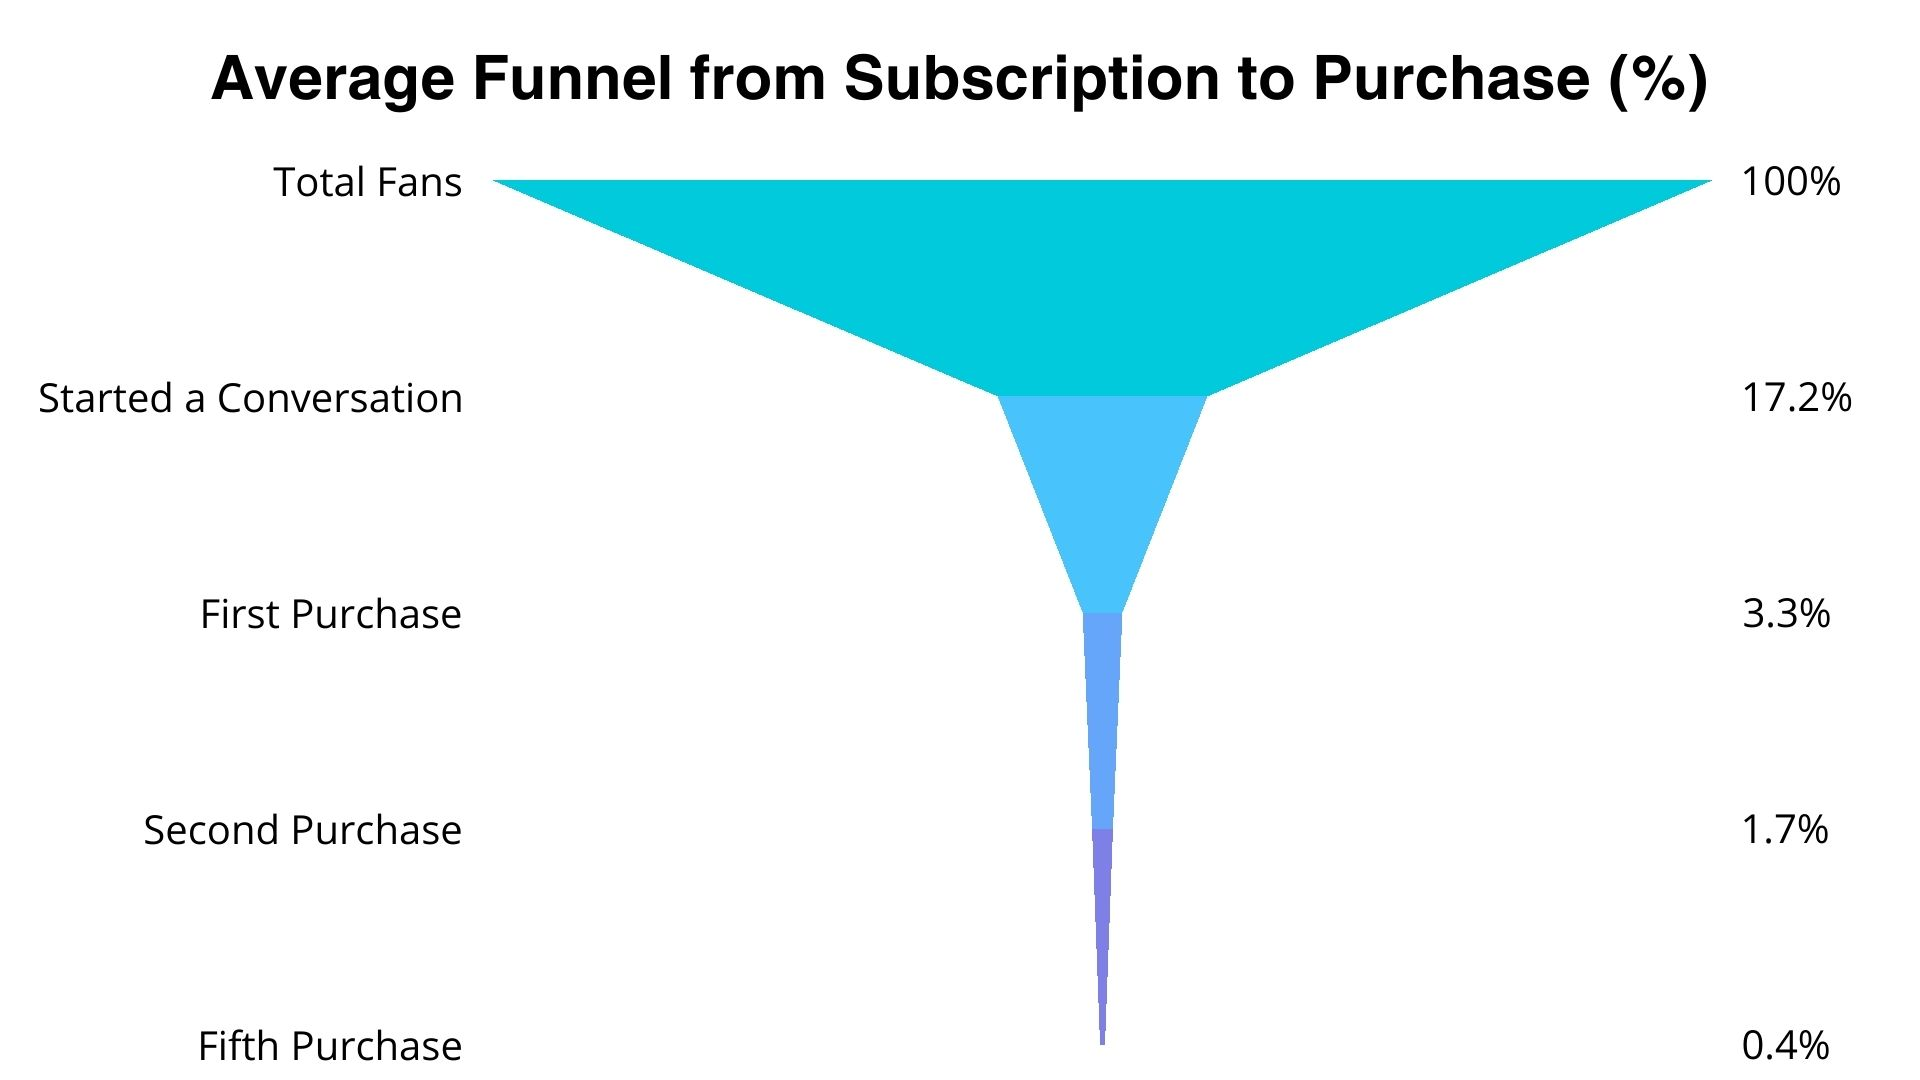
To clearly illustrate what the average funnel looks like across all OnlyFans traffic sources, we analyzed the same one million fans and tracked their journey.
Of those, 172,553 started a conversation.
- 32,800 made their first purchase.
- 17,199 made a second purchase.
- 4,079 reached their fifth purchase.
OnlyFans Conversion rates in percentages:
- Conversation — 17.19%
- First purchase — 3.27%
- Second purchase — 1.71%
- Only 0.41% of all fans made it to the fifth purchase.
Now let’s take a look at how the OnlyFans funnel performance changes across different OnlyFans traffic source
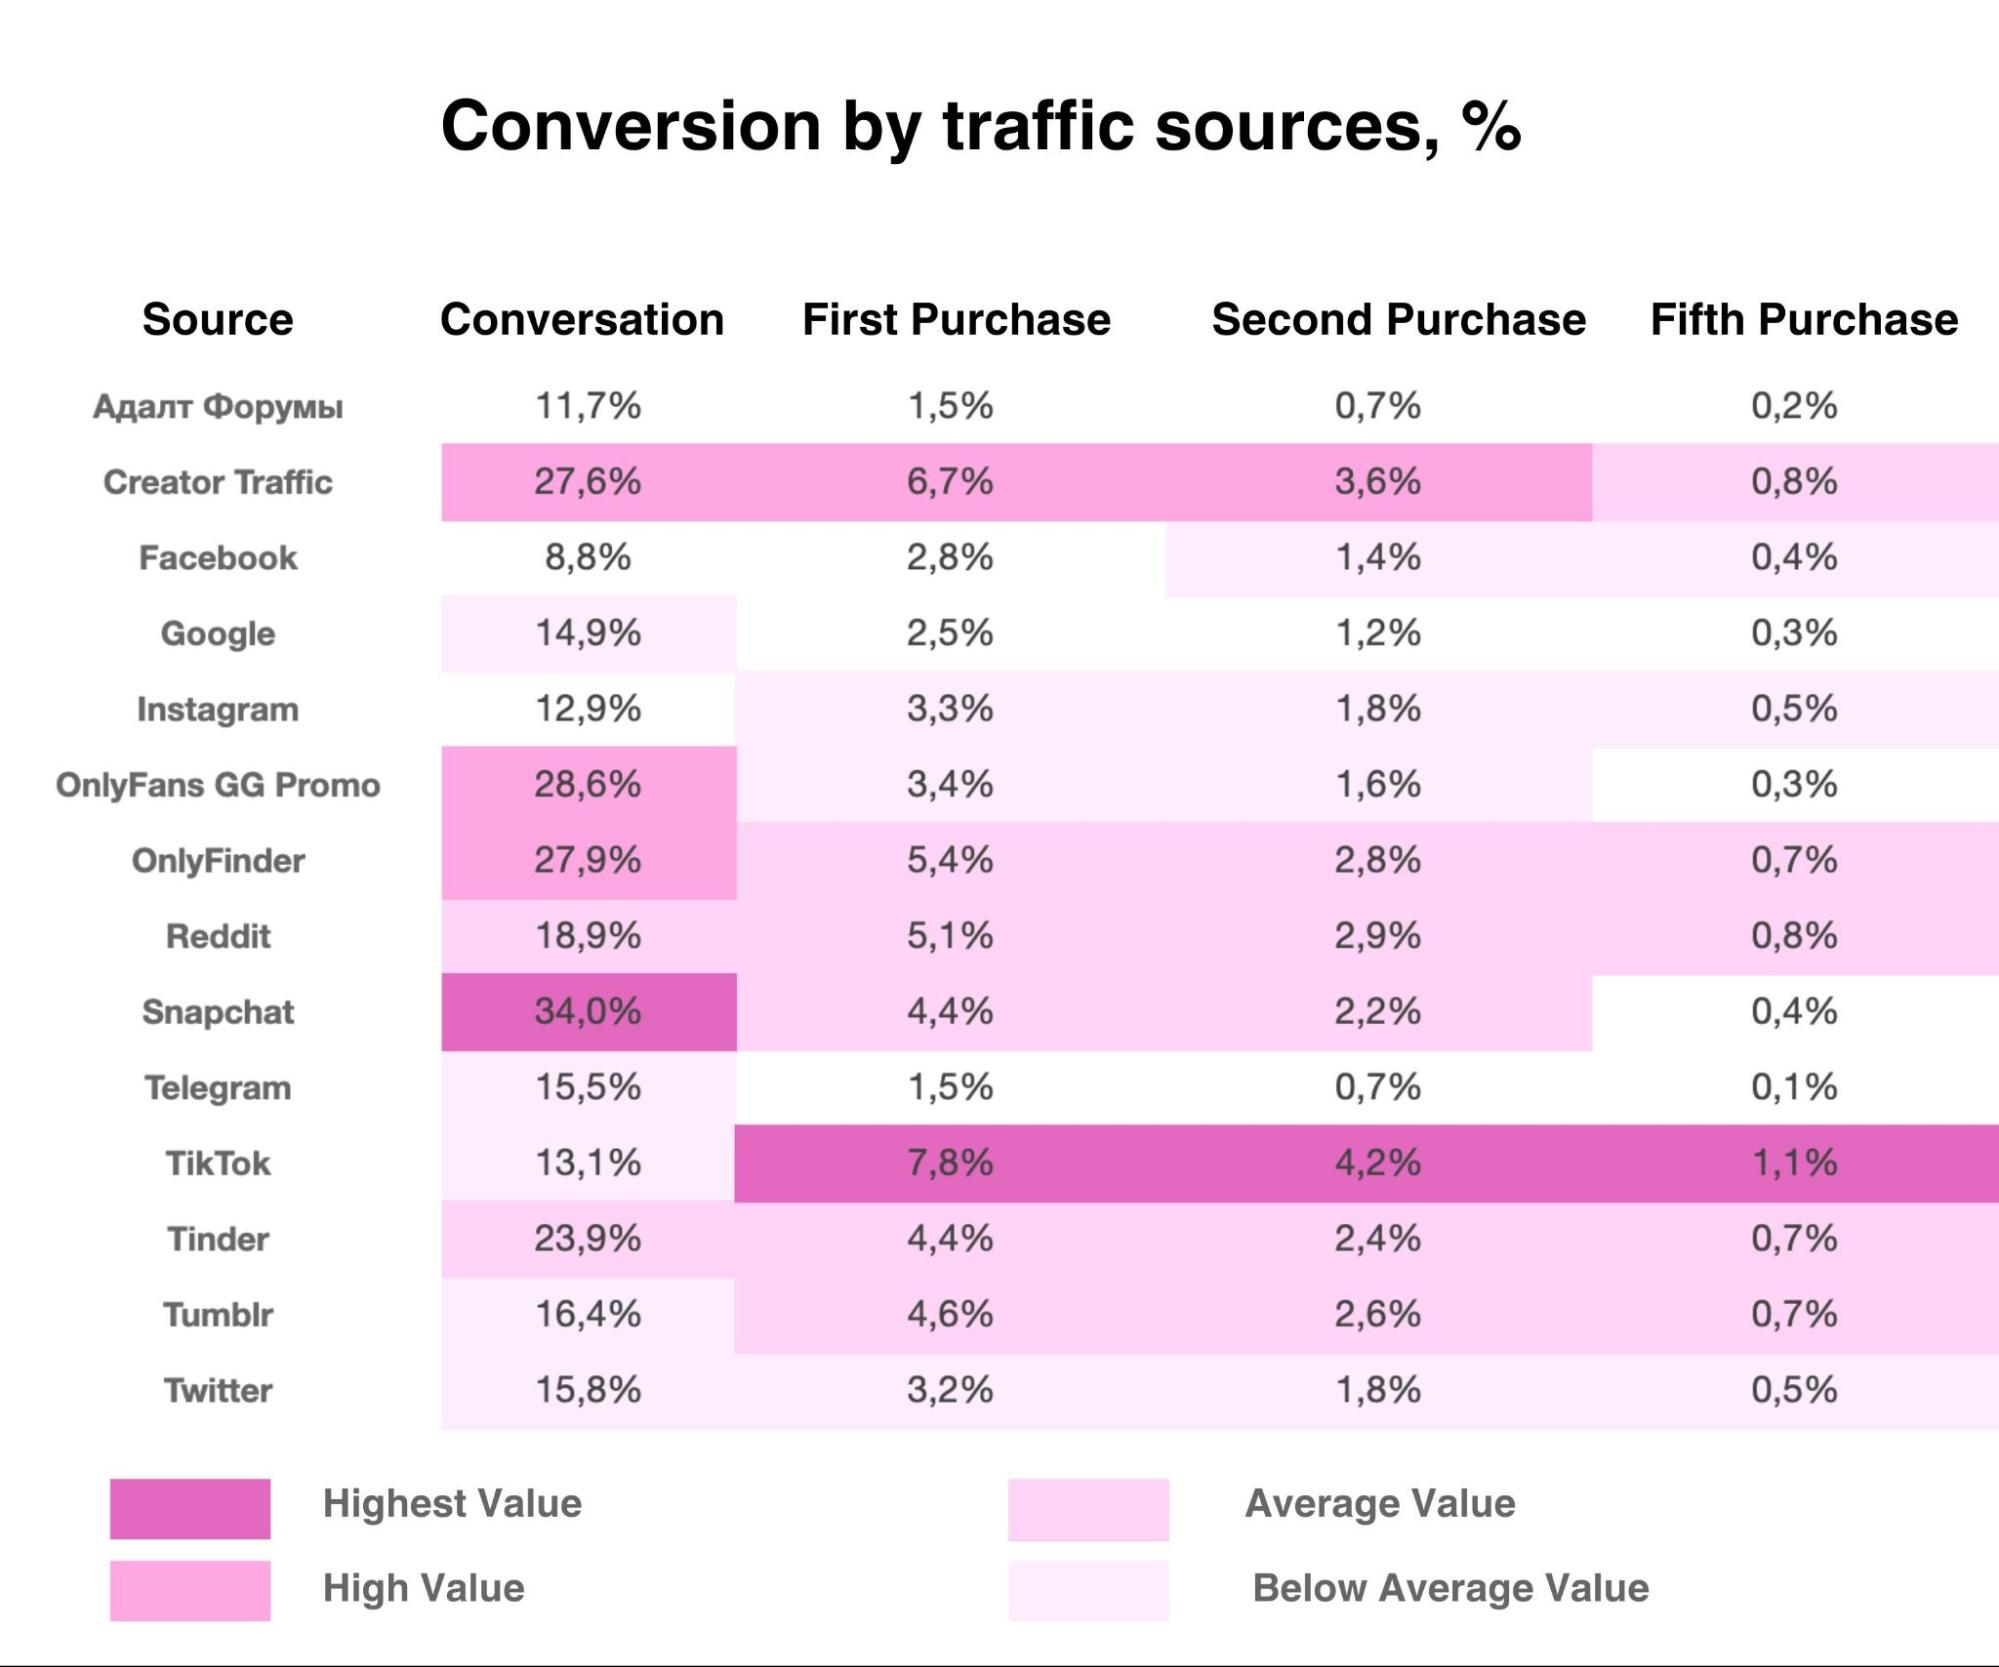
The table shows that Snapchat has the highest conversation conversion rate, but TikTok leads in both purchase conversion and fan lifespan, making it the top performer overall. Creator Traffic also shows strong results in OnlyFans conversion rates. On the other hand, adult forums, Google, and Telegram have the weakest metrics.
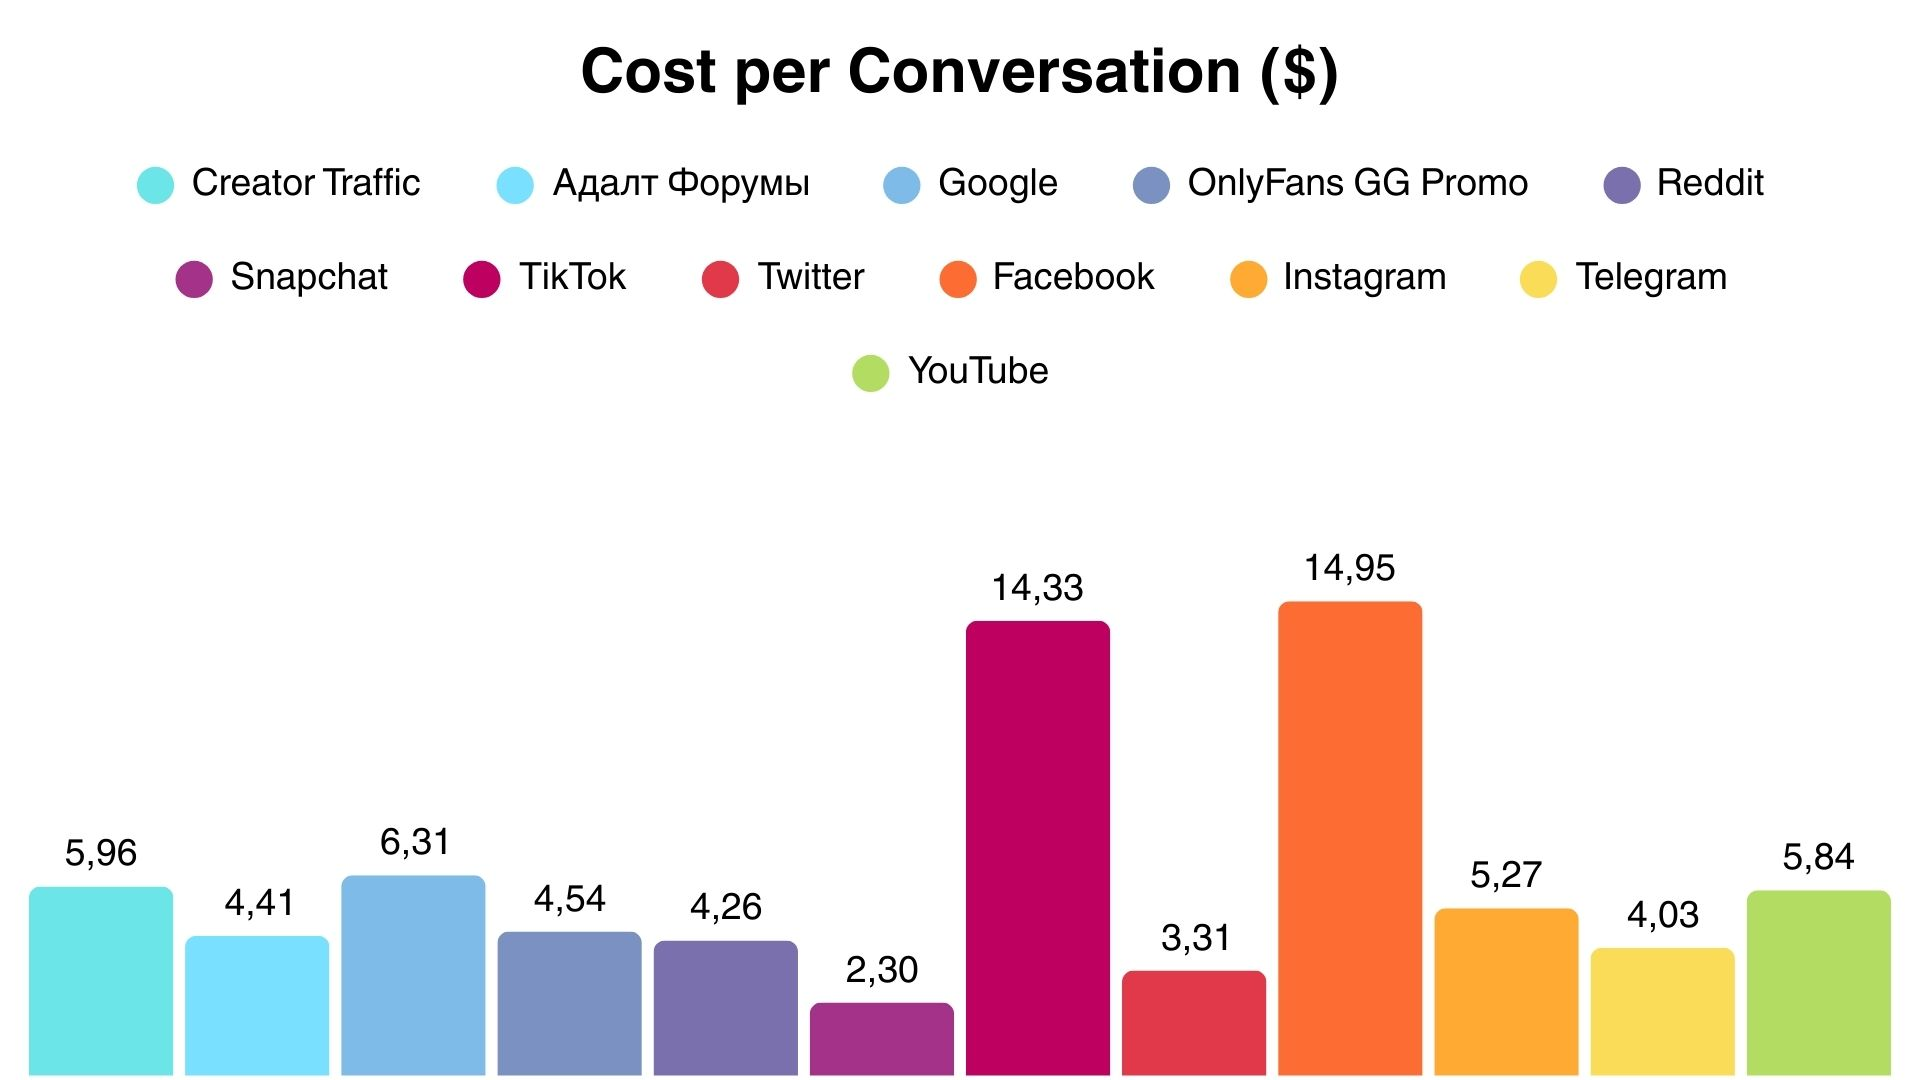
The cost per conversation varies significantly depending on the OnlyFans traffic source.
- Facebook has the highest cost at $14.95, and this is a key reason why many partners tend to avoid it.
- Coming in second, though still far ahead of the rest, is TikTok at $14.33.
- The lowest costs are seen on Snapchat and Twitter at $2.30 and $3.31, respectively.
Section Summary: Funnel Analysis
- OnlyFinder has the highest CTR for free pages.
- Overall conversion to first purchase is 3.27%.
- TikTok leads in purchase conversion and fan lifespan despite higher cost per conversion.
- Analyzing OnlyFans conversion rates per source is crucial for budget allocation.
ROMI: Return on Traffic from Different Sources (OnlyFans ROI Data)
ROMI is one of the most important metrics, as it shows whether the traffic is actually paying off. This OnlyFans ROI data is critical. To better observe how it changes over time, we calculated the average ROMI and divided the data into three time periods: 0 to 3 months, 3 to 6 months, and 6 to 12 months
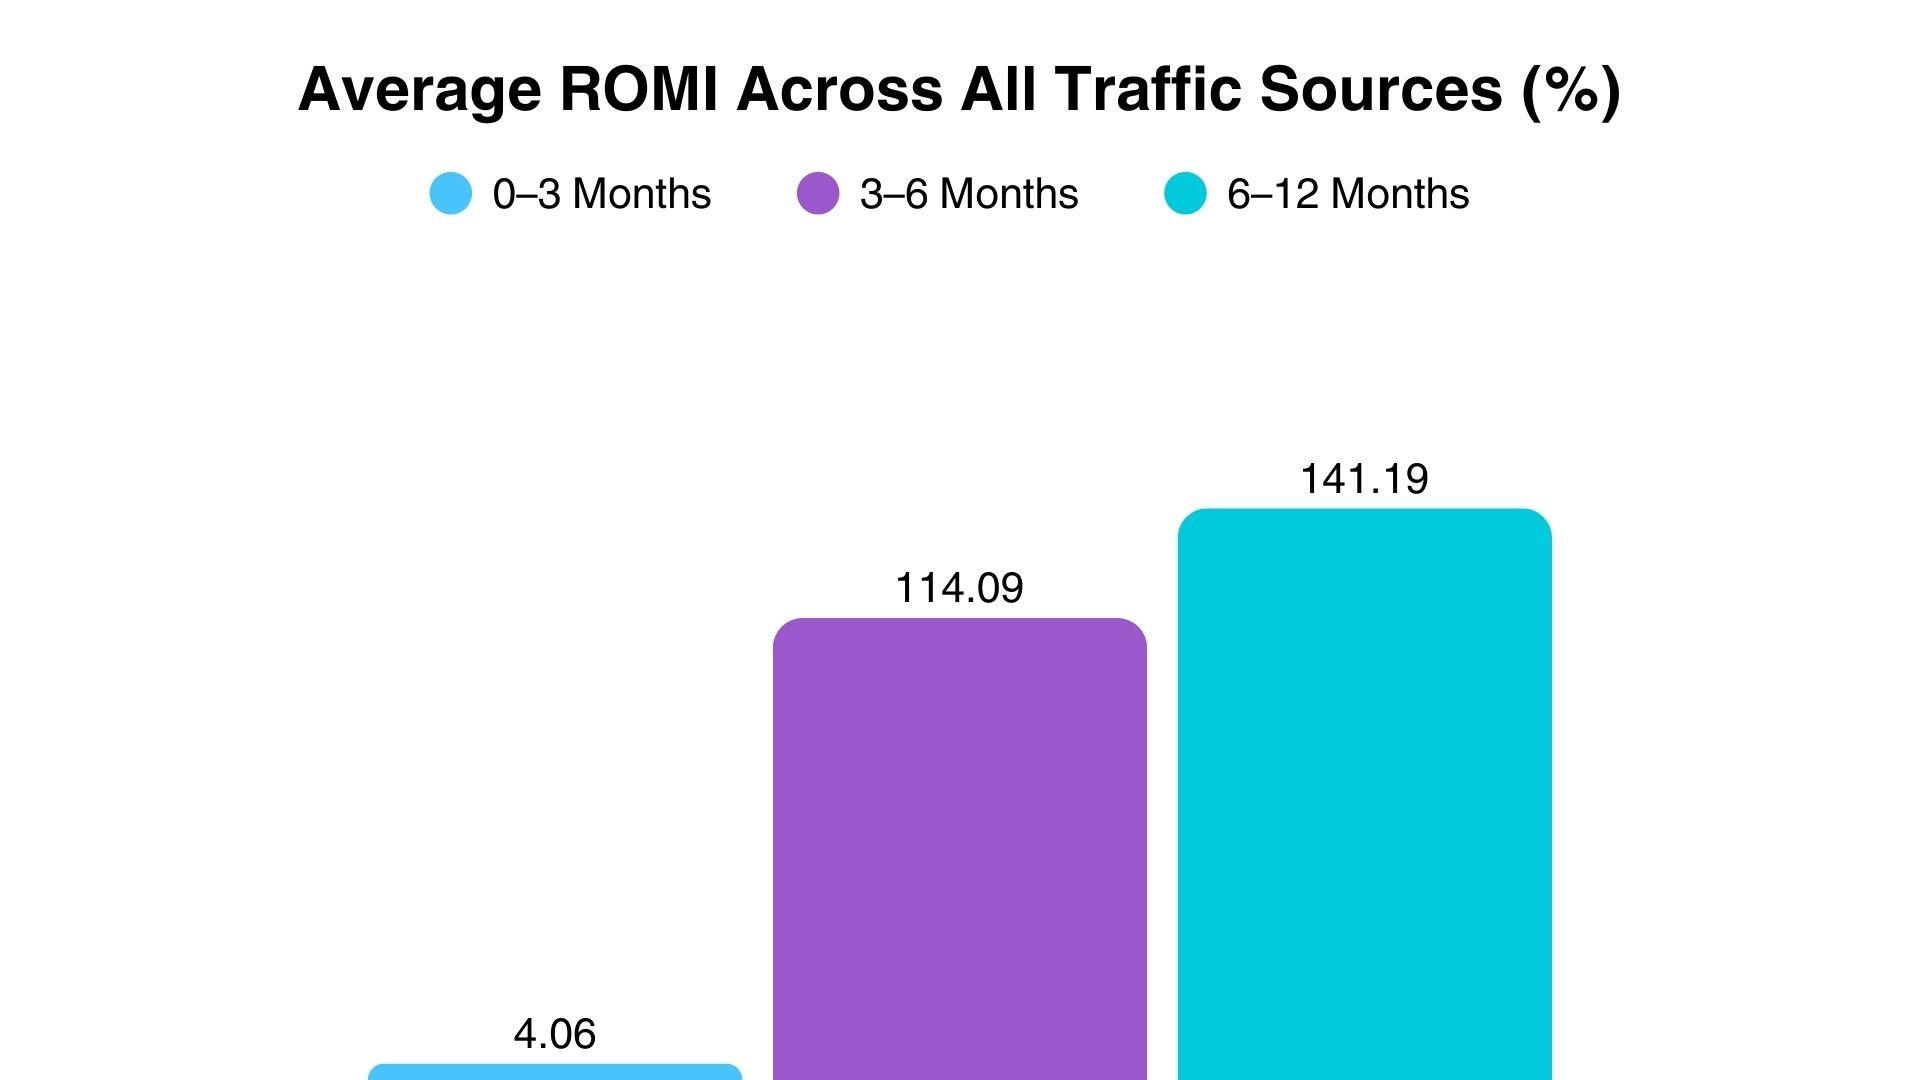
The chart shows that, on average, traffic reaches 114% ROI within the 3 to 6 month period, and the longer the time frame, the higher this number gets. It climbs to 141% when 6 to 12 months have passed. This also clearly demonstrates that regardless of the OnlyFans traffic source, it’s nearly impossible to accurately assess profitability if less than three months have passed since the fan subscribed to the page.
Now let’s take a look at the average return for different OnlyFans traffic sources based on the time period.
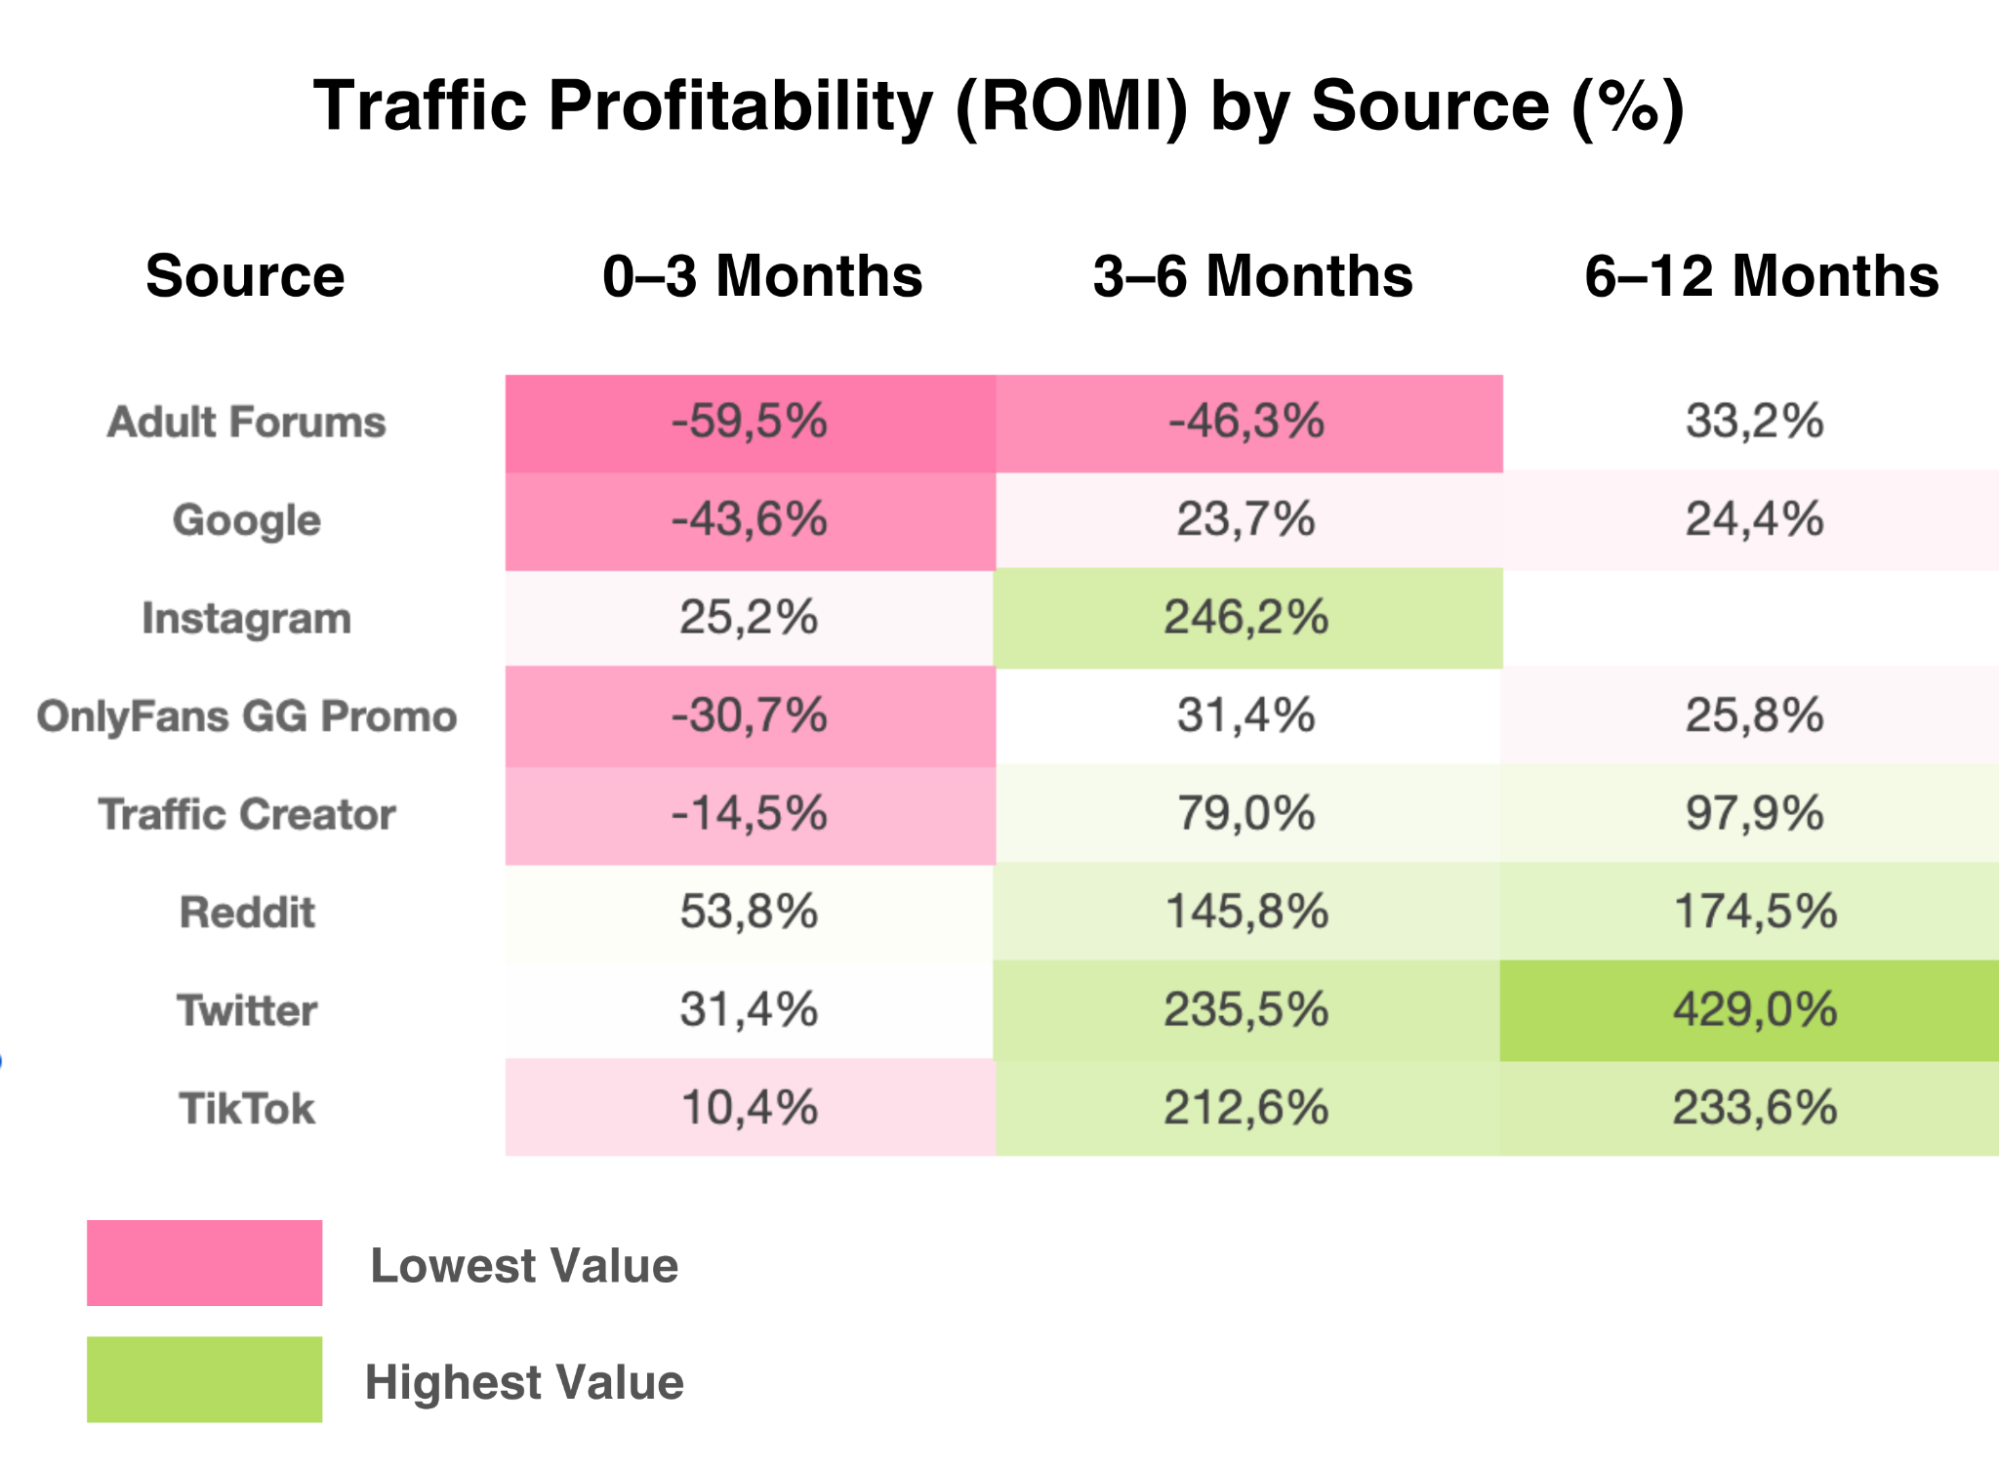
Twitter has the highest ROMI at 429%, and this is clearly visible in the long-term trend — though even in the short term, the traffic is already profitable. The weakest results come from adult forums, but even they become profitable over time, reaching 33.2% between 6 and 12 months. TikTok and Instagram show consistently strong performance in the 3 to 6 month range, with 212.6% and 246.2% ROMI, respectively. As for Instagram’s performance between months 6 and 12, we’re currently unable to evaluate it due to insufficient OnlyFans statistics.
Section Summary: ROMI
- Traffic generally becomes profitable between 3-6 months.
- Twitter shows the highest long-term ROMI.
- Adult forums have the weakest ROMI but can become profitable over time.
- This OnlyFans ROI data is essential for long-term strategy.
Top Offers: Understanding Creator Performance Analytics and Impact on Success
To choose the right offer, marketers need to take multiple factors into account — including the model’s type, how traffic is handled, and the quality of the content. All of these directly affect future earnings and are part of creator performance analytics. It’s also important to understand the specifics of working with each model type, since that determines the best way to engage with the audience. These are key OnlyFans marketing insights.
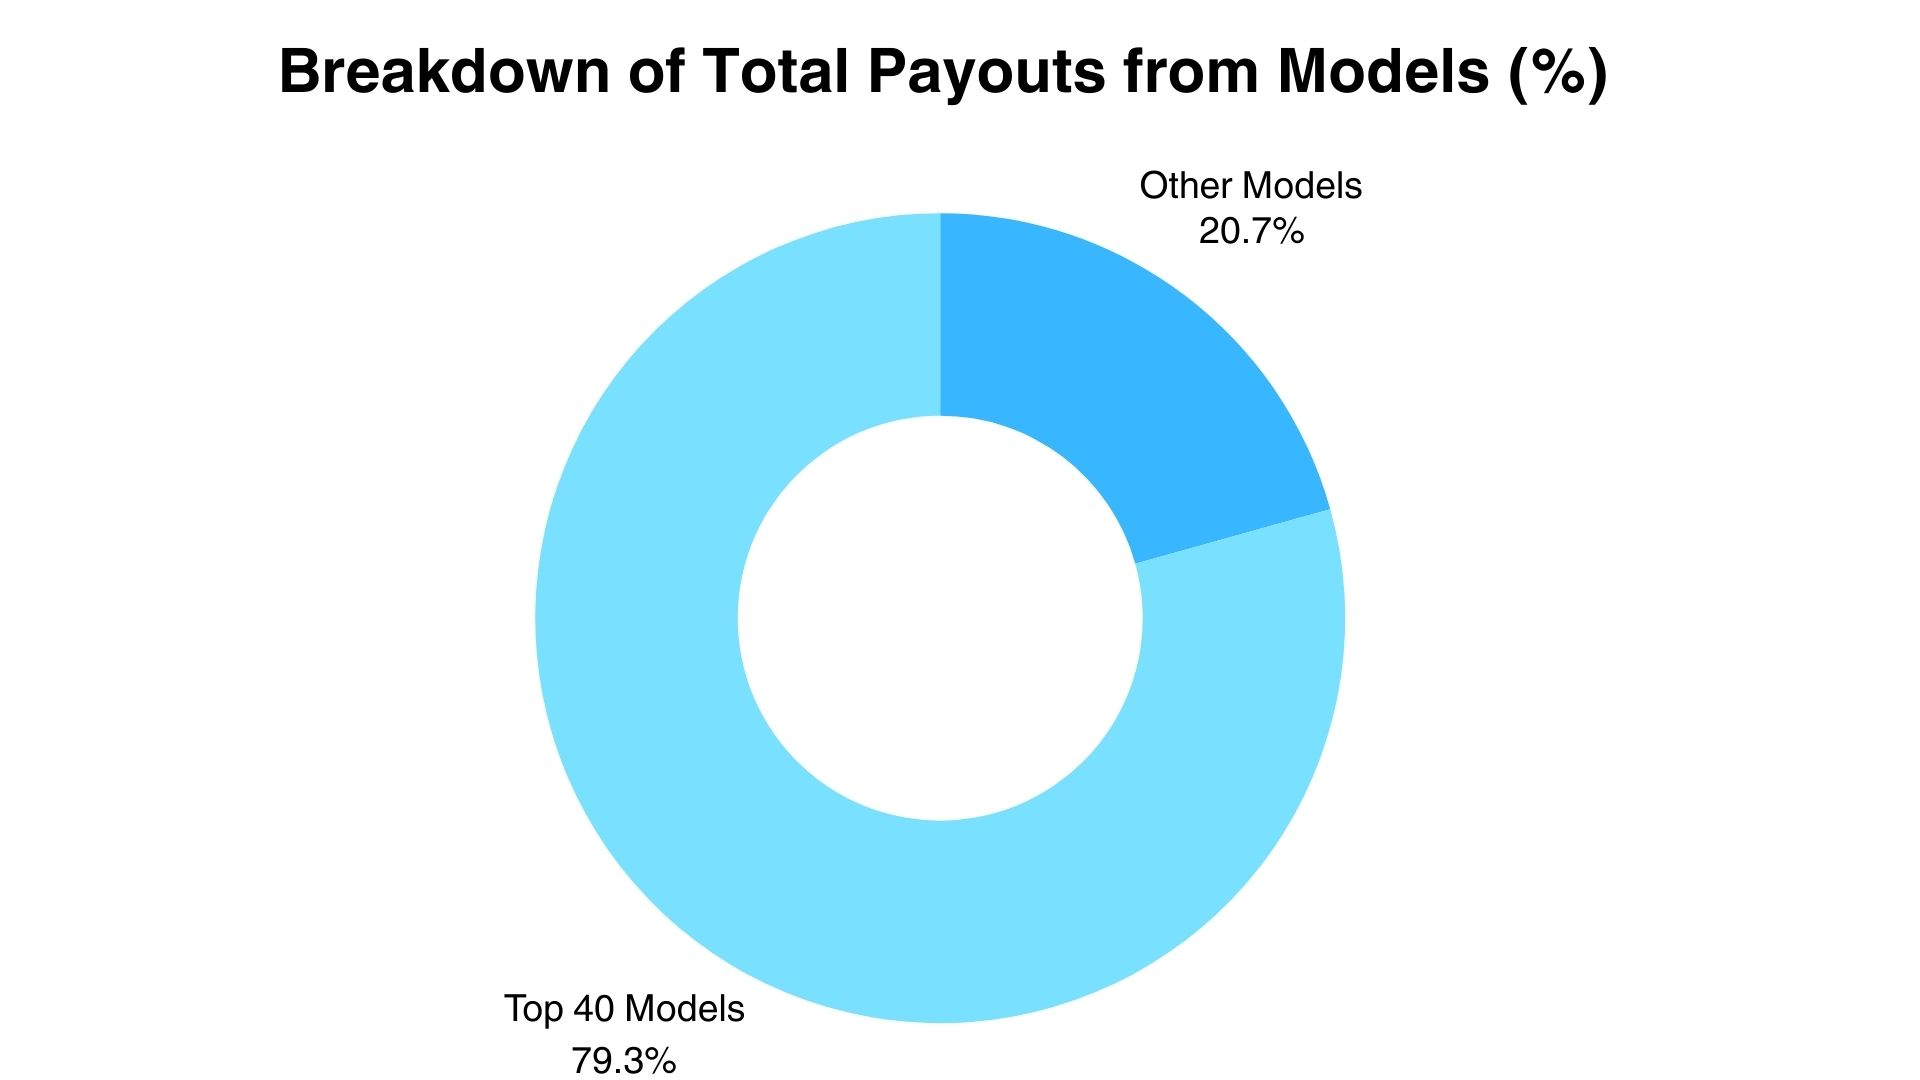
To show how this works, we gathered OnlyFans statistics on model offers and took a closer look at the unique characteristics of each one. Across one million fans, a total of 439 offers generated $515,331 in payouts to marketers. Of that, $408,833 — or 79.3% — came from just the top 40 models, which represents only 9.11% of the total. This highlights the impact of strong creator performance analytics
Top 5 Offer Analysis: What to Look for When Choosing a Model
Now let’s take a look at the top 5 performing offers and break down why their results are stronger than those of other models.
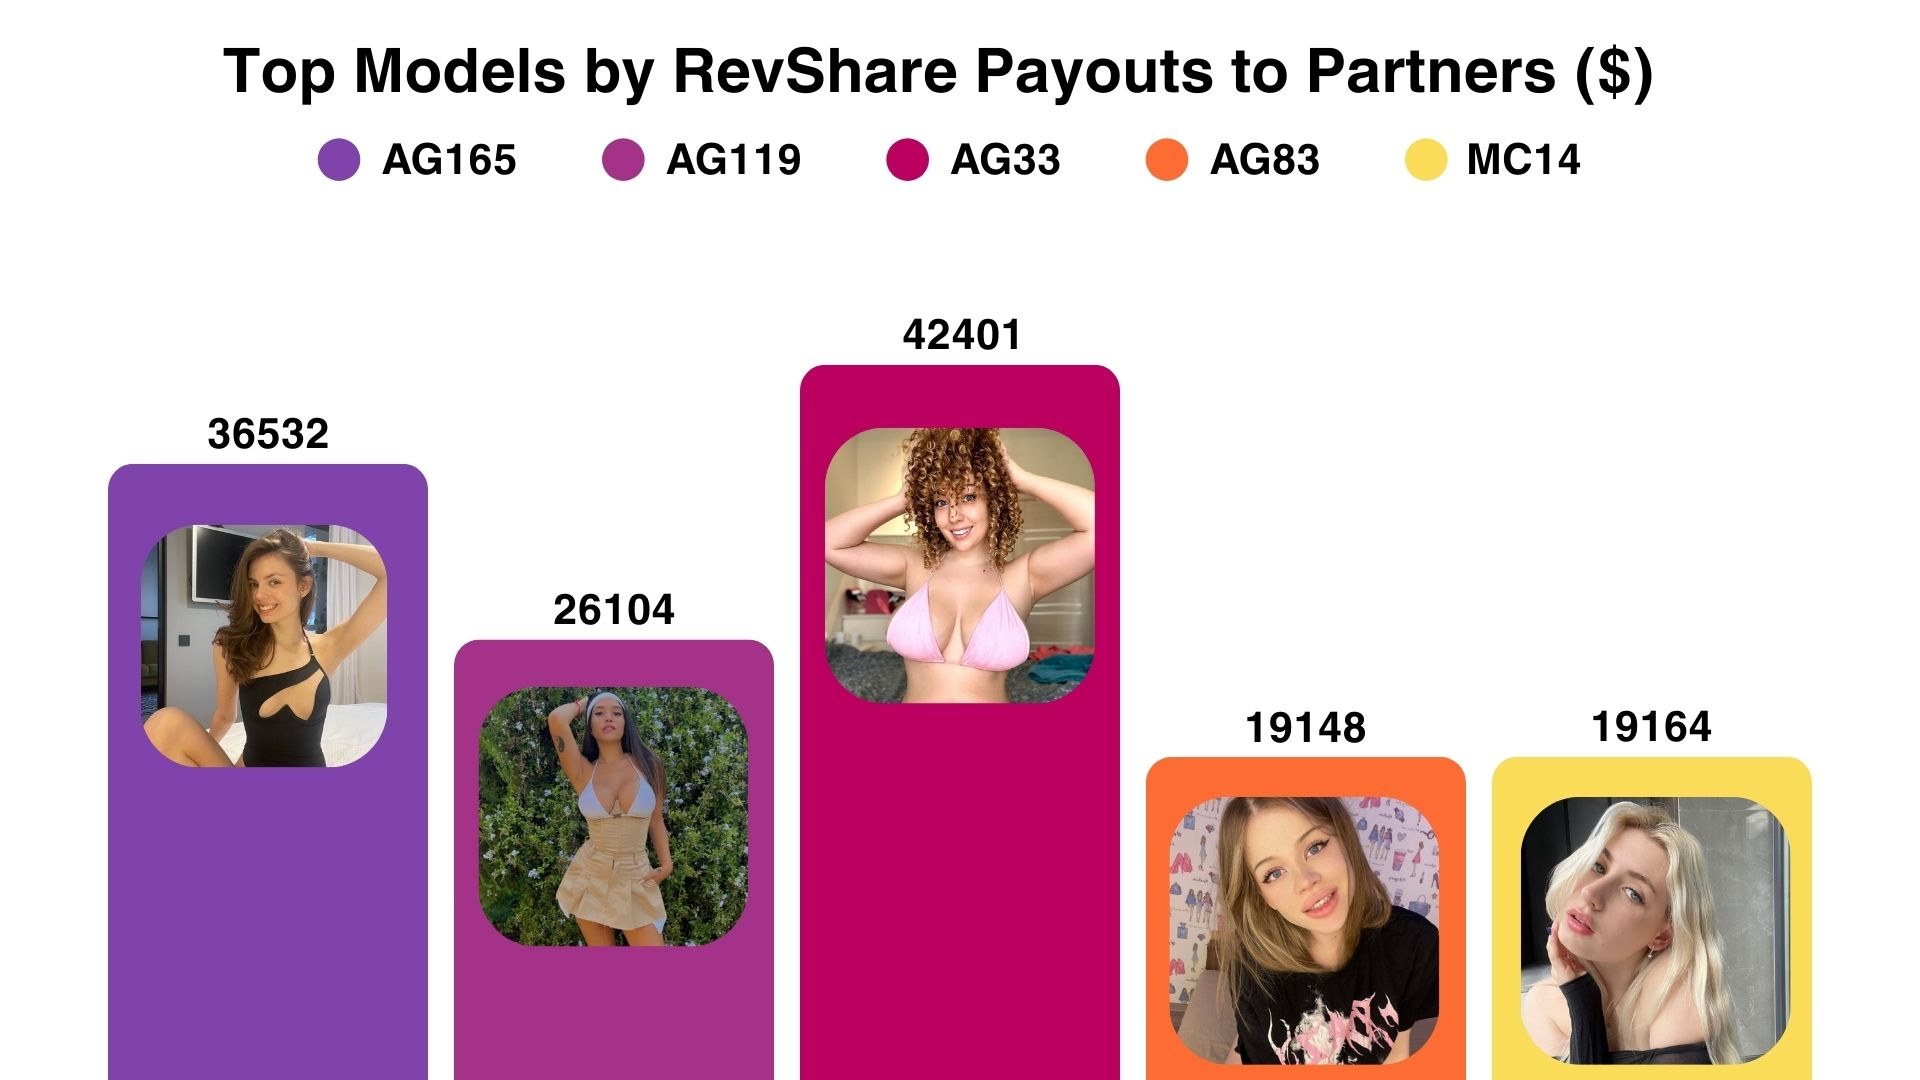
The highest earnings for partners came from model AG33, who generated $42,401. She falls into the Curvy category, meaning she has soft, natural curves that don’t quite reach plus-size. A key strength of AG33 is her volume of content across various platforms, giving partners room to experiment and attract more traffic. She also maintains a strong media presence and is active on social media. Her content quality is very high, with proper lighting, a good camera, and a strong understanding of flattering angles. On average, she produces between 100 and 200 pieces of content per week.
In second place is model AG165, with $36,532 in partner payouts. Her type is Natural, characterized by genuine facial and body features — no fillers, fake lashes, implants, or heavy makeup. Instead, she focuses on an authentic smile, expression, and real-life feel in her content. Reddit was her most active traffic source, but other channels also performed well in terms of ROI. She was extremely consistent, producing up to 200 pieces of content per week with no delays. Like AG33, her content was of high quality, using good lighting, a solid camera, and well-chosen angles. Currently, she is no longer active on OnlyTraffic.
Third place goes to model AG119, who brought in $26,104. Her type is Latina, with darker skin, dark hair, and an hourglass figure. Her main source of income came from Italian fans. Often, models with strong ethnic or regional identities generate high earnings from audiences in matching regions. For example, a Norwegian model might attract primarily Norwegian fans. These types of fan-model relationships tend to be deeper and more long-lasting.
The remaining two models, MC14 and AG83, earned $19,164 and $19,148, respectively. MC14 attracted fans with a cold and unattainable persona, which proved effective. AG83, on the other hand, hadn’t created new content in the past year, yet sales continued — although at half the volume compared to her active period. This was thanks to chatters who maintained long-term relationships with fans and knew how to sell well. AG83 is no longer active on OnlyFans.
This OnlyFans revenue breakdown for top models offers valuable lessons.
Section Summary: Top Offers
- A small percentage of models generate the majority of marketer payouts.
- Model type, content volume and quality, media presence, and regional appeal are key factors.
- Consistent content production and effective chattering significantly impact earnings.
- These creator performance analytics are vital for offer selection.
How a Marketer Can Increase Profit: Tips from the OnlyTraffic Team
We collected data from the top ten offers, including profit, subscriber count, and average revenue per fan. Using these OnlyFans marketing insights, we’ll walk through how to use OnlyFans analytics to increase revenue.
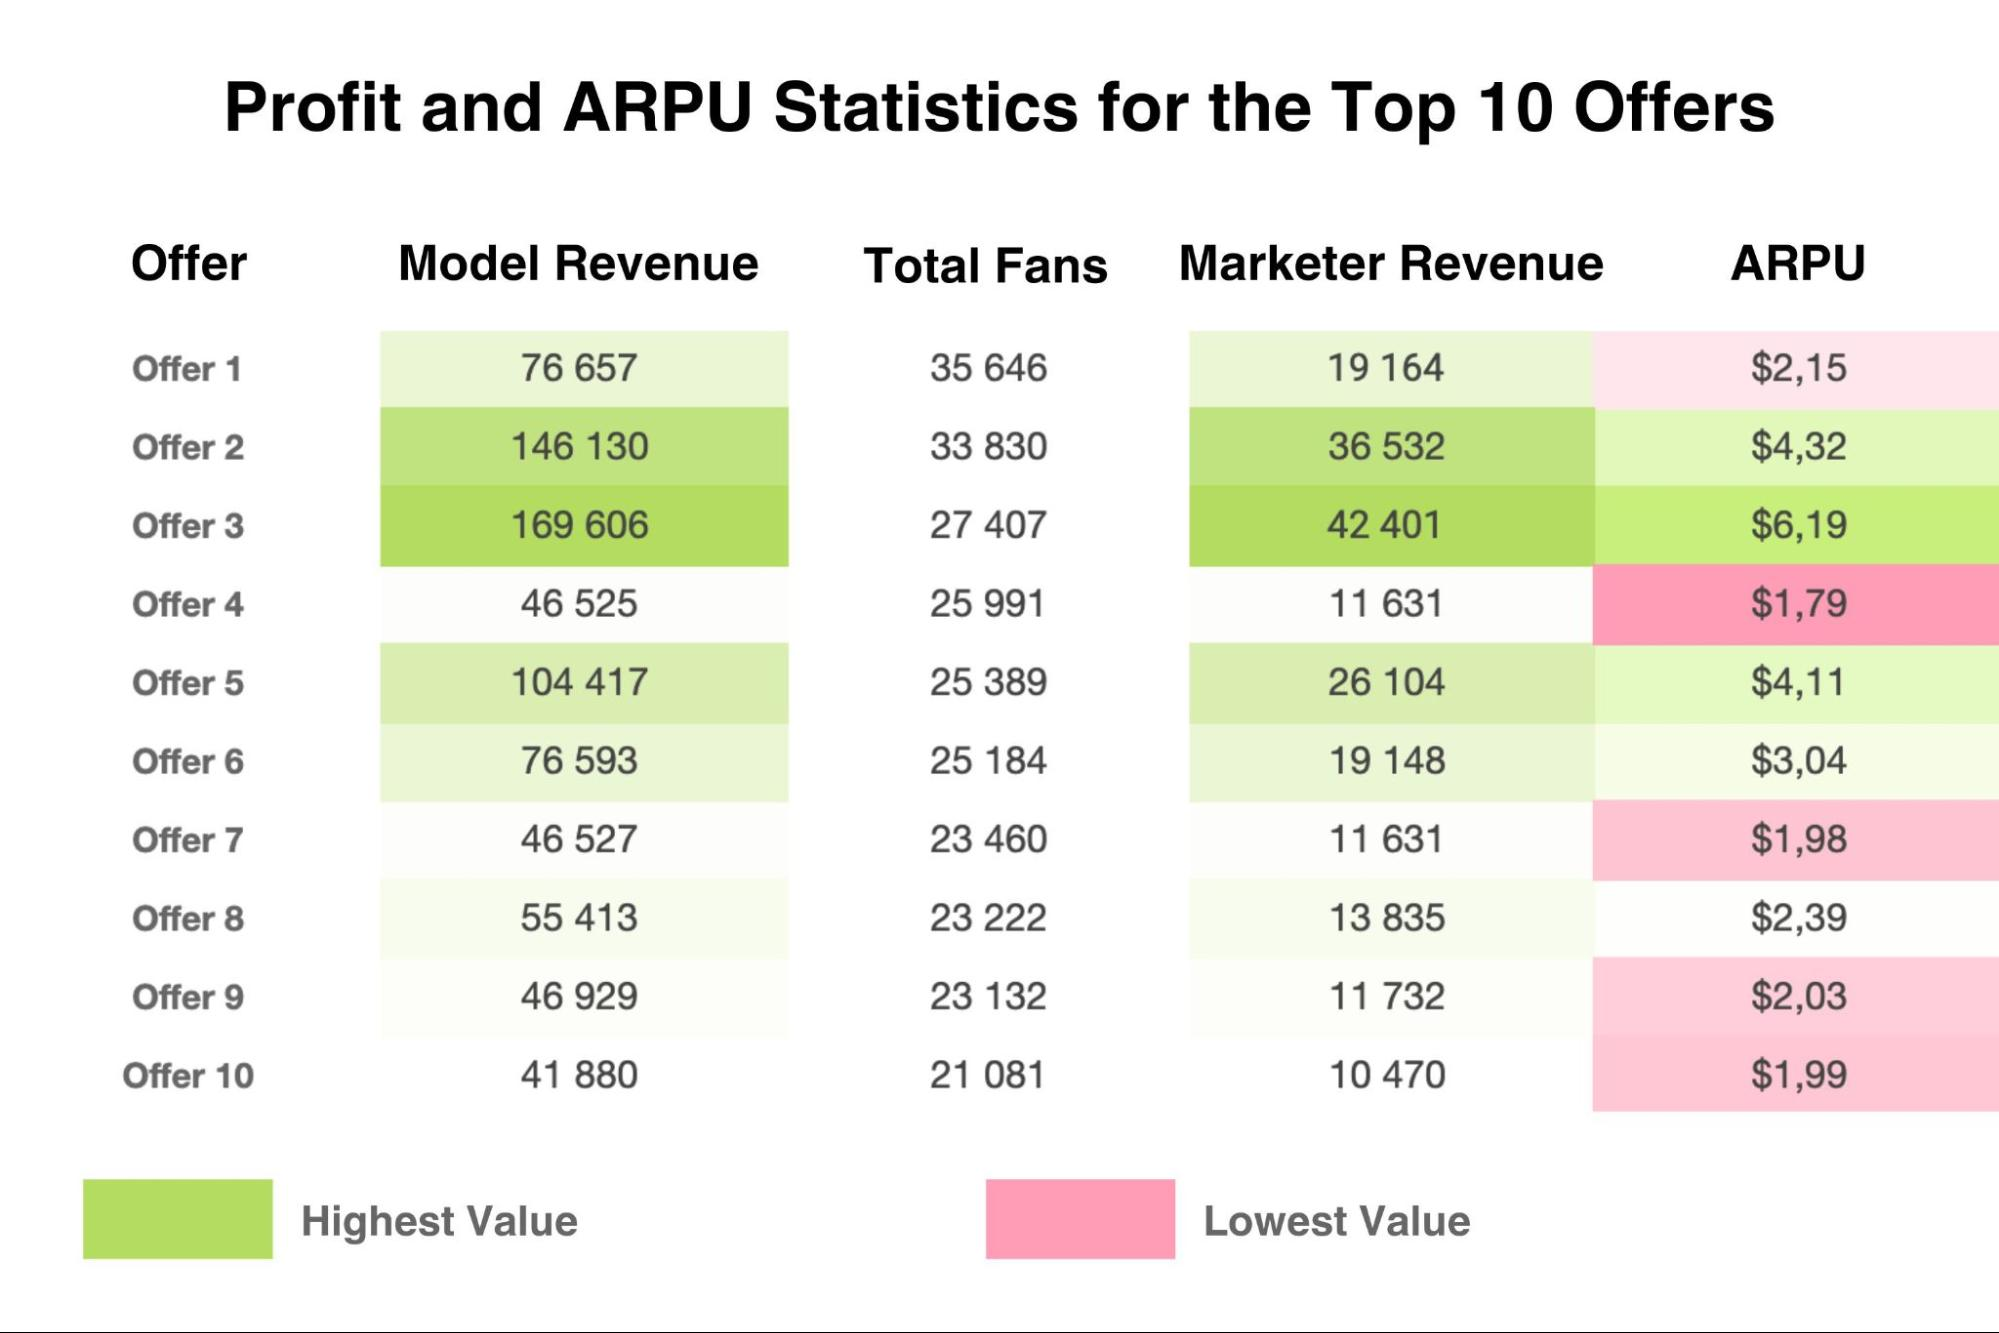
This table shows that the first three offers have the strongest performance in terms of both model revenue and ARPU. If we compare Offer #3 and Offer #4, we see that the number of subscribers marketers brought to each page is nearly the same — 27,407 and 25,991, respectively. However, profit and average revenue per fan are significantly different: $6.19 versus $1.79. This means that, in theory, if the same users had been sent to Offer #3 instead of #4, marketers could have earned 245.81% more — not $11,631, but $40,221.
To minimize lost profit, always test multiple offers for each OnlyFans traffic source, using at least 1,000 fans per test. This will help you find the option that generates the most revenue. Our managers are always available to help you choose the best offer based on experience and internal OnlyFans analytics — but nothing delivers better results than proper testing. This is a core principle of data-driven marketing for OnlyFans creators.
Of course, profit also depends on traffic quality, but in this case, we’re focusing on the calculation of missed revenue based on these OnlyFans statistics.
Section Summary: Increasing Profit
- Offer selection significantly impacts ARPU and overall profit, even with similar subscriber numbers.
- Test multiple offers for each traffic source (min. 1,000 fans per test).
- Leverage internal OnlyFans analytics and expert advice for offer selection.
Summary: Key Takeaways from Our OnlyFans Analytics and Statistics Report
According to the latest OnlyFans analytics and OnlyFans statistics, TikTok stands out as one of the top-performing OnlyFans traffic sources. It boasts high OnlyFans conversion rates, strong ROI, and the lowest percentage of subscribers who never complete a transaction. However, despite its strengths, TikTok’s average revenue per fan remains slightly below average on both free and paid pages. For marketers, it delivers the highest purchase conversion rate and fan lifespan, but with a trade-off: a significantly higher cost per conversation, reaching $14.33. This makes it a crucial component of actionable OnlyFans marketing insights.
Creator Traffic also performs exceptionally well. It ranks among the highest in ARPU for both free and paid pages, and has one of the lowest rates of non-transacting fans at just 93%. For marketers, Creator Traffic offers a high CTR, solid conversion and purchase rates, and a slightly above-average cost per conversation at $5.96. These metrics reflect highly effective OnlyFans fan behavior, though it’s important to note that performance from this source heavily depends on the marketer’s own engagement and effort.
Reddit ranks third overall and stands out as one of the best traffic sources for OnlyFans. It delivers affordable traffic, strong profitability, and impressive ARPU across both page types, $3.40 for free pages and $88.10 for paid pages. Its OnlyFans statistics also show a relatively low percentage of fans who never make a transaction, at 94%.
Facebook, on the other hand, performs the worst among the listed sources. It has one of the lowest ROI values, one of the weakest CTRs at just 4.84%, and poor OnlyFans conversion rates to conversation and purchase. At the same time, it has the highest cost per conversation, which is $14.95
Another key takeaway from our OnlyFans revenue breakdown is that whales and returning subscribers contribute the majority of a model’s income. However, the majority of fans tend to go inactive within the first three days of subscribing. Interestingly, some users delay their first purchase for up to a year, or even longer, highlighting the wide range of OnlyFans fan spending habits in 2025.
In building your 2025 strategy, these OnlyFans analytics and OnlyFans statistics should guide your decisions. Understanding how to track OnlyFans performance and leverage OnlyFans analytics is essential for growth and sustainability on the platform.
Why Is It Better to Drive Traffic Through OnlyTraffic?
We’ve spent the past two years building a platform that makes buying and selling traffic between models and marketers simple, efficient, and enjoyable. This analytics report clearly shows that many different factors affect profitability, and some of them might be completely unknown or overlooked by a marketer. Things like how chatters operate, how committed a model is to her work, or the average behavior of fans on her page can all impact results. The good news is, we handle all of that for you.
On top of that, the average price per subscriber in OnlyTraffic is higher than in chats or private groups, which means you can earn more. At the same time, partners are fully protected from scams or fraud on the model’s side. And by the way, we don’t charge any fees from marketers.
We hope this analytics breakdown is helpful and gives you clarity on how to better allocate your time, budget, and focus when planning your traffic strategy. You can sign up and get started right now. And don’t forget to follow our main Telegram-channel, plus the ones specifically for marketers and models.
Good luck!