The right OnlyFans promotion strategy can significantly boost earnings, save budgets, and help properly distribute the workload between the model and the marketer. To understand how, we analyzed data from 1 million fans who came through OnlyTraffic, and now we’re sharing it with you.
We’ve gathered statistics on traffic source performance, ROI, fan behavior on the model’s page, refunds, subscription renewals, and other key metrics. At the end of this article, we’ll sum up the entire analysis.
Key Statistics
To view long-term statistics on key metrics, we analyzed data from 1 million fans who went through our platform. This sample size is ideal for identifying average performance indicators.
Among all transaction types, Messages came first with 1,383,252 transactions. Tips followed with 537,386. Subscription payments reached 61,957, while renewals accounted for 36,266. Paid post purchases (PPV content) totaled 26,884. Streams had the fewest transactions, with only 200.

The total amount of all transactions was $2,045,944. Out of that, $412,823 (20.2%) came from just 100 fans — only 0.01% of the total user base. The remaining 999,900 subscribers generated 79.8% of the revenue. Refunds amounted to $21,339, which is just 1.03% of the total.

This clearly shows how crucial whales are on OnlyFans: each of these 100 users spent anywhere from $1,397 to $59,030. Interestingly, even a fan who spent just $1,500 over time already qualifies as a whale and falls into the tiny 0.01%, which means they deserve extra attention. The work of chatters directly impacts a model’s income, as they are the ones who build long-term relationships with subscribers.
Out of the one million fans, only 4.2% made a transaction, while 95.8% didn’t make a single purchase. We'll take a closer look at how these numbers vary depending on the traffic source in the next section, “Traffic Sources.”

Transactions were distributed fairly evenly across the week, without any sharp spikes or drops. Still, Saturdays saw the highest share at 15.4%, while Wednesdays had the lowest at 13.6%. The most active days were Friday, Saturday, and Sunday, while the least active were Monday, Tuesday, and Wednesday.

Traffic Sources: ARPU and Average Cost per Subscriber
We separated the statistics and data into free and paid pages to see which traffic sources work best for each type.
Free pages
Out of all the fans who subscribed to free pages, 147,718 came from Twitter and 143,323 from Google. Reddit contributed 57,979, followed by OnlyFans GG Promo with 42,748 and Telegram with 41,739. Instagram brought in 32,511 fans, while Creator Traffic accounted for 16,015. Tumblr generated 14,562, TikTok brought in 13,154, adult forums added 10,614, and Snapchat contributed 10,538. Additional traffic sources are shown in the chart below.

One of the key metrics for models and marketers is ARPU, which shows the average revenue per user. We gathered data from free pages to see how this metric varies across different traffic sources.
YouTube had the highest ARPU at $5.9, followed by Creator Traffic at $4.2. OnlyFinder came in third with $3.9. Reddit and Tumblr were tied at $3.4. The lowest ARPU was seen on Telegram, at just $0.9.

Paid pages
To analyze user behavior on paid pages, we calculated the average ARPU only from fans who actually paid for a subscription, in order to avoid skewing the data with discounts and promotions.

Reddit had the highest ARPU, averaging $88.1 per paid subscriber. Creator Traffic followed closely with $81.8. TikTok performed below average with $22.5, nearly the same as Instagram at $23.5. YouTube showed the lowest ARPU at $13.7.
This suggests that driving traffic from TikTok to a paid page may not be the most effective strategy, while Reddit can deliver strong results.
It's important to remember that these figures also depend on the model’s page itself. For example, if a page is overloaded with promo posts and SFS, it can negatively impact ARPU, ROI, and other key metrics.
Average Cost per Subscriber (CPL) and Percentage of Fans with No Transactions
We also analyzed the percentage of fans with no transactions across all page types, broken down by traffic source. The lower the percentage on the chart, the better. For example, the most effective source was TikTok, with only 77% of fans not making a transaction. The highest percentages were seen in Telegram and Creator Traffic, both at 98%.

In addition to RevShare, OnlyTraffic also offers the option to buy fans through the CPL model.
On average, a fan from Twitter cost $0.50. Google averaged $1.40 per fan, while OnlyFans GG Promo came in at $1.30. Reddit and Instagram both averaged $1.00, TikTok was slightly lower at $0.90, adult forums matched Twitter at $0.50, and YouTube averaged $0.80.

Fan Behavior and Lifetime on a Model’s Page: LTV and Average Lifespan
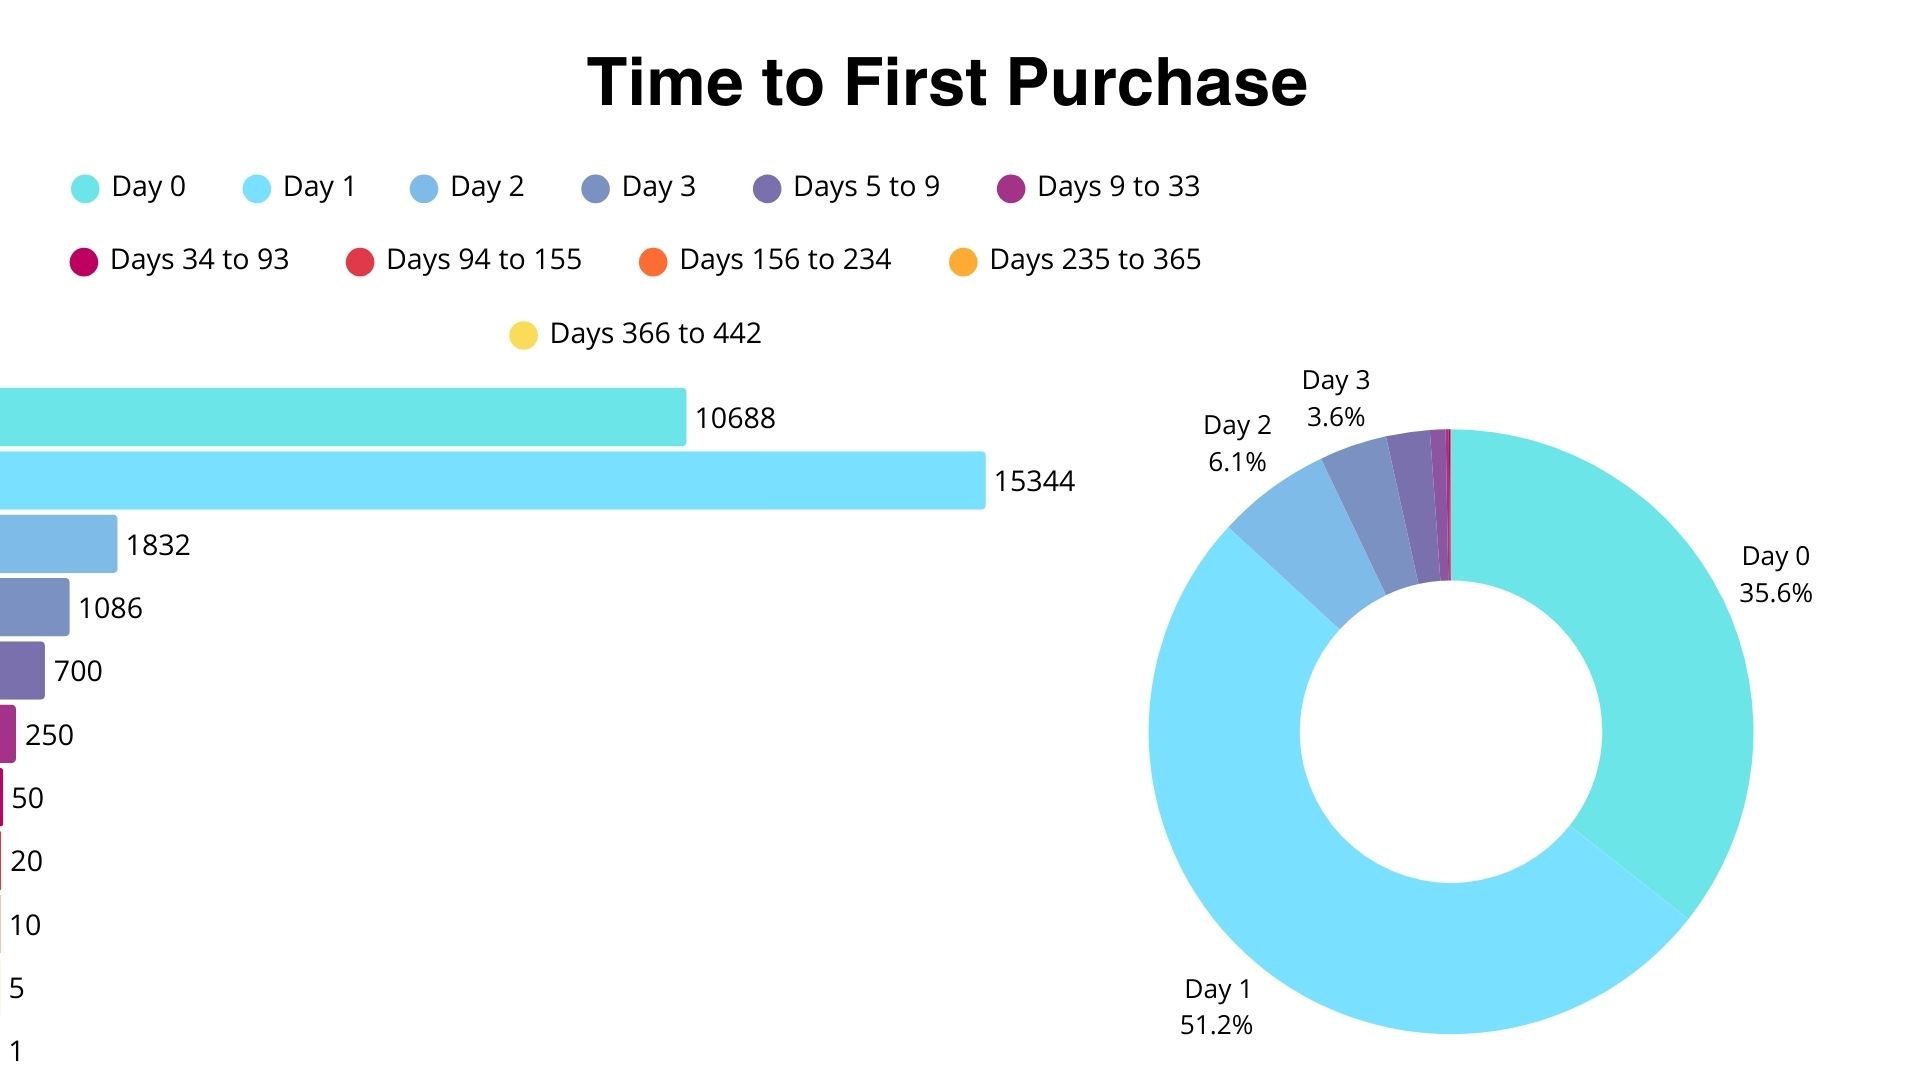
We analyzed 30,000 users who made a transaction to identify key behavior metrics on a model’s page. Most fans stopped engaging after the second day — 50.3%, or 11,870 users. The second largest group consisted of those who made a purchase on the day they subscribed and then disappeared — 29.5%, or 6,960 fans. Less than 5% stayed active for more than 10 days. The average fan lifespan on a model’s page was 44.85 days.

Now let’s take a look at the time between subscription and the first purchase. On the first day, 35.6% of users — or 10,688 fans — made a purchase. But more often, purchases happened on the second day: 52.2%, or 15,344 fans. Interestingly, some fans didn’t make their first purchase until more than 400 days after subscribing, though they made up less than 1% of the total.
On paid pages, fans renewed their subscription in 18.4% of cases.
Funnel Analysis: CTR, ROMI, and Other Metrics
Let’s move on to funnel analysis and take a look at CTR and conversion rates by traffic source, the cost per conversation, and the return on marketing investment (ROMI).
CTR: A Metric of Ad Performance and Audience Interest
The CTR metric shows how willing users from different sources are to subscribe to a page. Simply put, it reflects how often a click turns into a subscription. This helps us better understand the audience, their interests, and their needs. For this analysis, we used data only from models’ free pages.

OnlyFinder showed the highest CTR at 52.13%, followed by Creator Traffic and OnlyFans GG Promo. The lowest CTRs were recorded for PopUnder at 0.38% and PreRoll at 0.25%.
CTR often depends on whether the audience from a given source already has an OnlyFans account. For example, OnlyFinder is a directory site specifically for finding models, meaning the traffic is highly targeted which naturally results in a higher CTR.
OnlyFans Sales Funnel Analysis: From Subscription to Purchase
To clearly illustrate what the average funnel looks like across all traffic sources, we analyzed the same one million fans and tracked their journey.
Of those, 172,553 started a conversation, 32,800 made their first purchase, 17,199 made a second purchase, and 4,079 reached their fifth purchase.
Conversion rates in percentages: conversation — 17.19%, first purchase — 3.27%, second purchase — 1.71%, and only 0.41% of all fans made it to the fifth purchase.

Now let’s take a look at how the funnel changes across different traffic sources.

The table shows that Snapchat has the highest conversation conversion rate, but TikTok leads in both purchase conversion and fan lifespan, making it the top performer overall. Creator Traffic also shows strong results. On the other hand, adult forums, Google, and Telegram have the weakest metrics.
The cost per conversation varies significantly depending on the traffic source. Facebook has the highest cost at $14.95, and this is a key reason why many partners tend to avoid it. Coming in second, though still far ahead of the rest, is TikTok at $14.33. The lowest costs are seen on Snapchat and Twitter at $2.30 and $3.31, respectively.

ROMI: Return on Traffic from Different Sources
ROMI is one of the most important metrics, as it shows whether the traffic is actually paying off. To better observe how it changes over time, we calculated the average ROMI and divided the data into three time periods: 0 to 3 months, 3 to 6 months, and 6 to 12 months.

The chart shows that, on average, traffic reaches 114% ROI within the 3 to 6 month period, and the longer the time frame, the higher this number gets. It climbs to 141% when 6 to 12 months have passed. This also clearly demonstrates that regardless of the traffic source, it’s nearly impossible to accurately assess profitability if less than three months have passed since the fan subscribed to the page.
Now let’s take a look at the average return for different traffic sources based on the time period.

Twitter has the highest ROMI at 429%, and this is clearly visible in the long-term trend — though even in the short term, the traffic is already profitable. The weakest results come from adult forums, but even they become profitable over time, reaching 33.2% between 6 and 12 months. TikTok and Instagram show consistently strong performance in the 3 to 6 month range, with 212.6% and 246.2% ROMI, respectively. As for Instagram’s performance between months 6 and 12, we’re currently unable to evaluate it due to insufficient data.
Top Offers: Understanding How Model Types, Content, and Traffic Handling Impact Success
To choose the right offer, marketers need to take multiple factors into account — including the model’s type, how traffic is handled, and the quality of the content. All of these directly affect future earnings. It’s also important to understand the specifics of working with each model type, since that determines the best way to engage with the audience.
To show how this works, we gathered statistics on model offers and took a closer look at the unique characteristics of each one.
Across one million fans, a total of 439 offers generated $515,331 in payouts to marketers. Of that, $408,833 — or 79.3% — came from just the top 40 models, which represents only 9.11% of the total.

Top 5 Offer Analysis: What to Look for When Choosing a Model
Now let’s take a look at the top 5 performing offers and break down why their results are stronger than those of other models.

The highest earnings for partners came from model AG33, who generated $42,401. She falls into the Curvy category, meaning she has soft, natural curves that don’t quite reach plus-size. A key strength of AG33 is her volume of content across various platforms, giving partners room to experiment and attract more traffic. She also maintains a strong media presence and is active on social media. Her content quality is very high, with proper lighting, a good camera, and a strong understanding of flattering angles. On average, she produces between 100 and 200 pieces of content per week.
In second place is model AG165, with $36,532 in partner payouts. Her type is Natural, characterized by genuine facial and body features — no fillers, fake lashes, implants, or heavy makeup. Instead, she focuses on an authentic smile, expression, and real-life feel in her content. Reddit was her most active traffic source, but other channels also performed well in terms of ROI. She was extremely consistent, producing up to 200 pieces of content per week with no delays. Like AG33, her content was of high quality, using good lighting, a solid camera, and well-chosen angles. Currently, she is no longer active on OnlyTraffic.
Third place goes to model AG119, who brought in $26,104. Her type is Latina, with darker skin, dark hair, and an hourglass figure. Her main source of income came from Italian fans. Often, models with strong ethnic or regional identities generate high earnings from audiences in matching regions. For example, a Norwegian model might attract primarily Norwegian fans. These types of fan-model relationships tend to be deeper and more long-lasting.
The remaining two models, MC14 and AG83, earned $19,164 and $19,148, respectively. MC14 attracted fans with a cold and unattainable persona, which proved effective. AG83, on the other hand, hadn’t created new content in the past year, yet sales continued — although at half the volume compared to her active period. This was thanks to chatters who maintained long-term relationships with fans and knew how to sell well. AG83 is no longer active on OnlyFans.
How a Marketer Can Increase Profit: Tips from the OnlyTraffic Team
We collected data from the top ten offers, including profit, subscriber count, and average revenue per fan. Using these insights, we’ll walk through how a marketer can increase profit from their traffic.
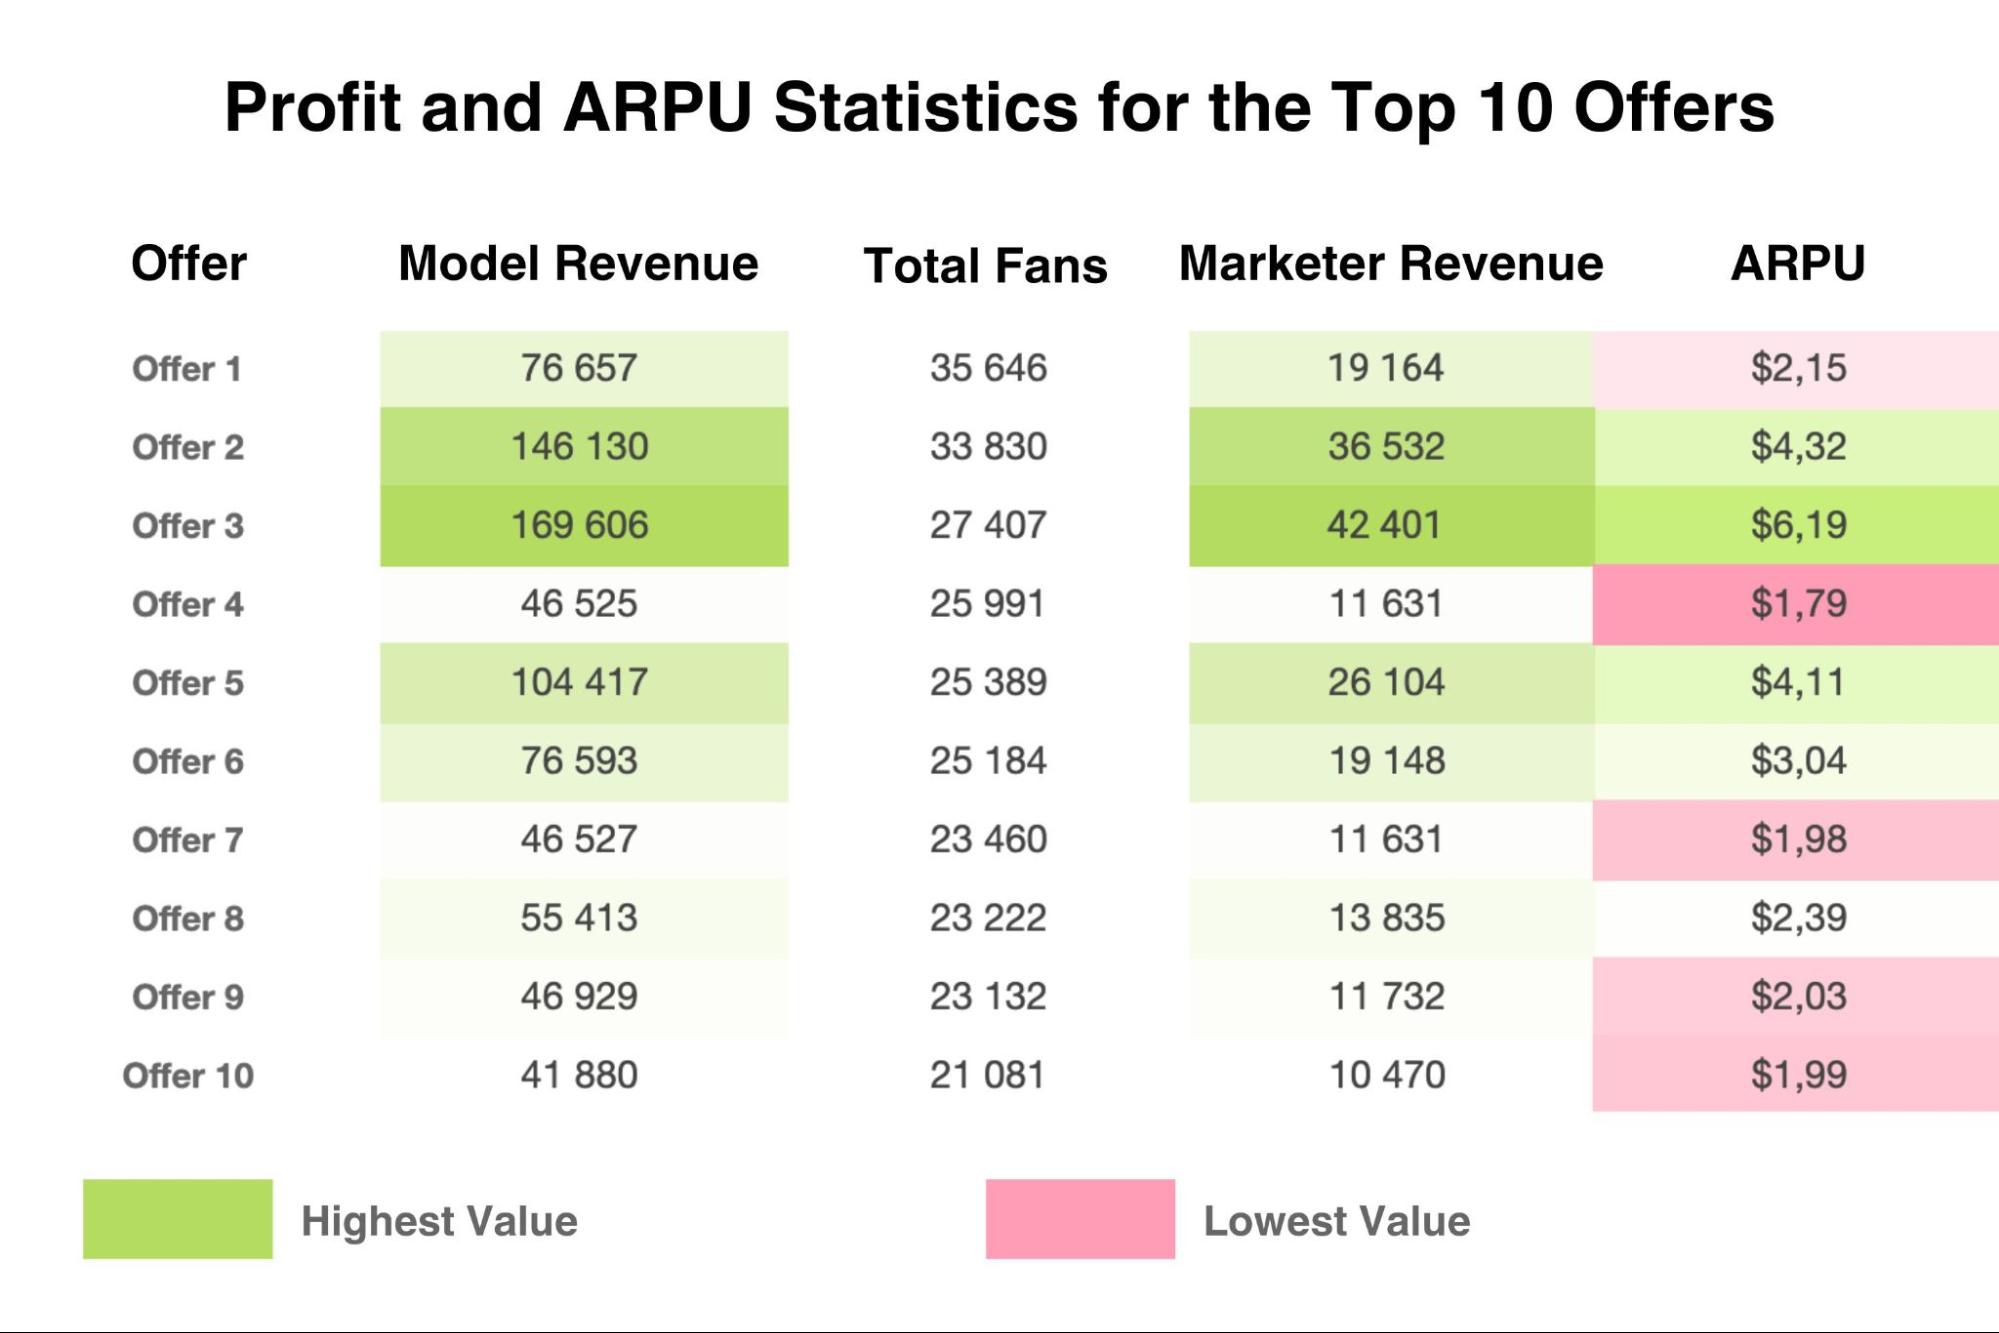
This table shows that the first three offers have the strongest performance in terms of both model revenue and ARPU. If we compare Offer #3 and Offer #4, we see that the number of subscribers marketers brought to each page is nearly the same — 27,407 and 25,991, respectively. However, profit and average revenue per fan are significantly different: $6.19 versus $1.79. This means that, in theory, if the same users had been sent to Offer #3 instead of #4, marketers could have earned 245.81% more — not $11,631, but $40,221.
To minimize lost profit, always test multiple offers for each traffic source, using at least 1,000 fans per test. This will help you find the option that generates the most revenue. Our managers are always available to help you choose the best offer based on experience and internal data — but nothing delivers better results than proper testing.
Of course, profit also depends on traffic quality, but in this case, we’re focusing on the calculation of missed revenue.
Summary
According to the data, TikTok stands out among all traffic sources with strong overall performance. It shows high conversion rates and strong ROI, along with the lowest percentage of subscribers who never make a transaction. However, its average revenue per fan is slightly below average on both free and paid pages. For marketers, TikTok delivers the highest purchase conversion rate and fan lifespan, but the cost per conversation is significantly higher than other sources, reaching $14.33.
Creator Traffic also performs well across the board. It has one of the highest ARPU values on both free and paid pages, and the percentage of fans with no transactions is also among the lowest, at 93%. For marketers, Creator Traffic offers a high CTR, strong conversation and purchase conversions, and a slightly above-average cost per conversation at $5.96. It’s worth noting, however, that this source heavily depends on the marketer’s involvement. You can’t simply launch an ad through a dashboard and expect results — it requires manual work and optimization.
Reddit ranks third overall and could be considered the most cost-effective source. It offers affordable traffic, solid profitability, and high ARPU on both page types: $3.40 on free pages and $88.10 on paid pages. It also has a lower percentage of fans with no transactions compared to other sources, at 94%.
Facebook, on the other hand, performs the worst among the listed sources. It has one of the lowest ROI values, one of the weakest CTRs at just 4.84%, and poor conversion rates to conversation and purchase. At the same time, it has the highest cost per conversation, which is $14.95 — and this is a key reason why many marketers avoid it.
In addition to all this, whales and returning subscribers make up the majority of a model’s income. However, most fans become inactive within the first three days after subscribing. Interestingly, there are still users who make their first purchase a year or even a year and a half after signing up.
Why Is It Better to Drive Traffic Through OnlyTraffic?
We’ve spent the past two years building a platform that makes buying and selling traffic between models and marketers simple, efficient, and enjoyable. This analytics report clearly shows that many different factors affect profitability — and some of them might be completely unknown or overlooked by a marketer. Things like how chatters operate, how committed a model is to her work, or the average behavior of fans on her page can all impact results. The good news is, we handle all of that for you.
On top of that, the average price per subscriber in OnlyTraffic is higher than in chats or private groups, which means you can earn more. At the same time, partners are fully protected from scams or fraud on the model’s side. And by the way — we don’t charge any fees from marketers.
We hope this analytics breakdown is helpful and gives you clarity on how to better allocate your time, budget, and focus when planning your traffic strategy. You can sign up and get started right now. And don’t forget to follow our main Telegram-channel, plus the ones specifically for marketers and models.
Good luck!