OnlyFans Subscriber LTV and Cross-Sales: What 2 Million Transactions Reveal
Most OnlyFans agencies measure traffic ROI on a 7-day or 30-day window. We've watched this happen across our own platform for years, and it's the single biggest reason agencies undervalue the traffic they buy.
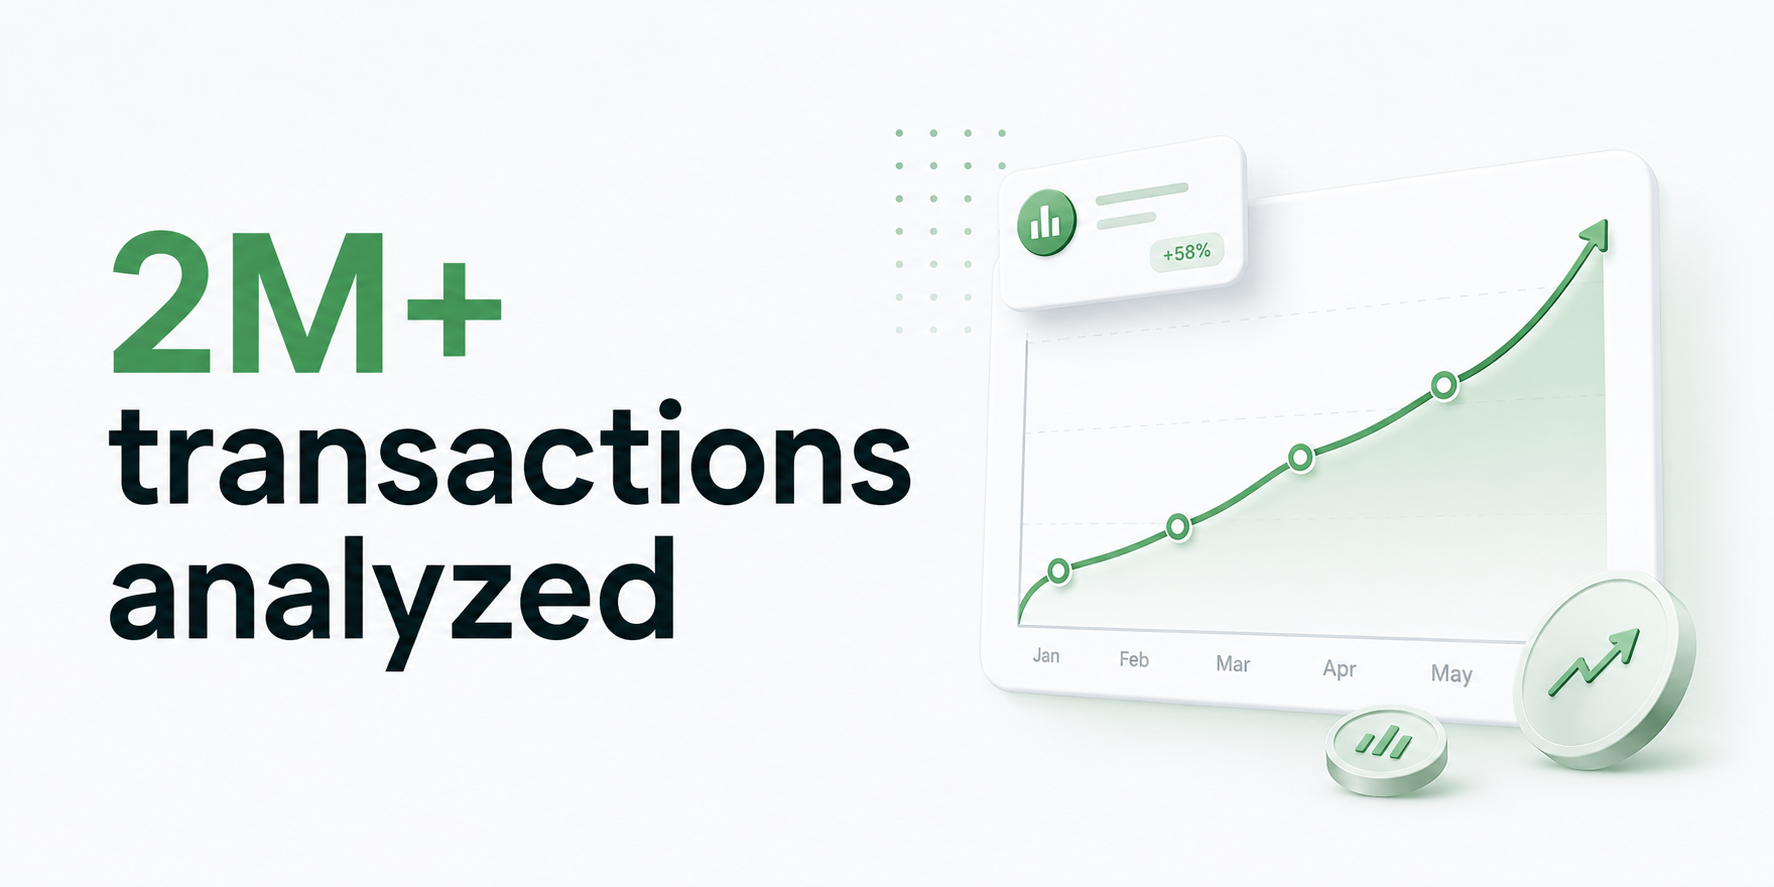
So we did something nobody in the industry has published before. We took our aggregated dataset (over 2 million subscriber transactions flowing through OnlyTraffic from free OnlyFans pages only) and mapped exactly when fans actually spend money relative to when they subscribed. Then we mapped how much of that revenue ends up on other models in the same agency's portfolio through cross-sales.
The results explain why so many agencies kill profitable offers too early.
If you've read our earlier breakdown OnlyFans Statistics and Analytics (1M fans, traffic sources, conversion funnels), this is the next chapter. Same methodology, deeper question, focused on subscriber economics over time.
TL;DR. On free OnlyFans pages: day 0 produces only ~20% of total fan revenue. The first 30 days give ~50%. The remaining ~50% comes between month 2 and year 2. On top of that, cross-sales typically add another 20-40% (and up to 70% for the most operationally mature agencies). If you're calculating ROI on a 30-day window without cross, you're seeing roughly half the real value of your traffic.
Why we wrote this
If you run an OnlyFans agency, you already know the drill. You buy traffic. Some fans pay on day one, some don't. You look at your dashboard at the 30-day mark, run the numbers, and decide which offers to scale and which to kill.
The problem is that the 30-day mark is exactly where most agencies make their worst decisions. We've seen agencies pause offers at -20% ROI on day 30 that would have hit +180% by month 12. We've seen others double down on offers that look great early but burn out fast. Same dashboard, same numbers, completely different outcomes. The day-30 view doesn't tell you which case you're looking at.
This article is what we wish more partners read before they make those calls. The data behind it is real, it's from our own platform, and as far as we know nobody else has published anything close to this depth on subscriber behavior at this scale.
What the data is (and what it isn't)
A few things worth getting out of the way upfront, so you can judge the numbers properly.
The dataset is aggregated from free OnlyFans pages only. These are pages where fans subscribe at no cost and revenue is generated entirely through PPV content, tips, and offers inside the chat. Paid-page economics work differently and are not represented here.
The data comes from agencies that gave us explicit permission to include their numbers in aggregated research. It is not the full OnlyTraffic client base. Your specific agency will see different exact numbers depending on niche, model archetype, chat quality, pricing strategy, GEO of fans, and traffic sources. The shape of the curves below tends to hold across the dataset, and that's the part you can lean on. The absolute numbers, that's yours to measure.
We're not publishing dollar figures, ARPU, or per-model economics. Those are commercially sensitive and vary too widely to publish responsibly. We are publishing distributions, percentages, and ranges.
Finding 1: Day zero is only one fifth of the picture
We grouped every transaction by subscriber age in days at the moment of the transaction (day 0 = the day the fan subscribed). Then we measured what percentage of total revenue each age bucket produced across the full population of fans.
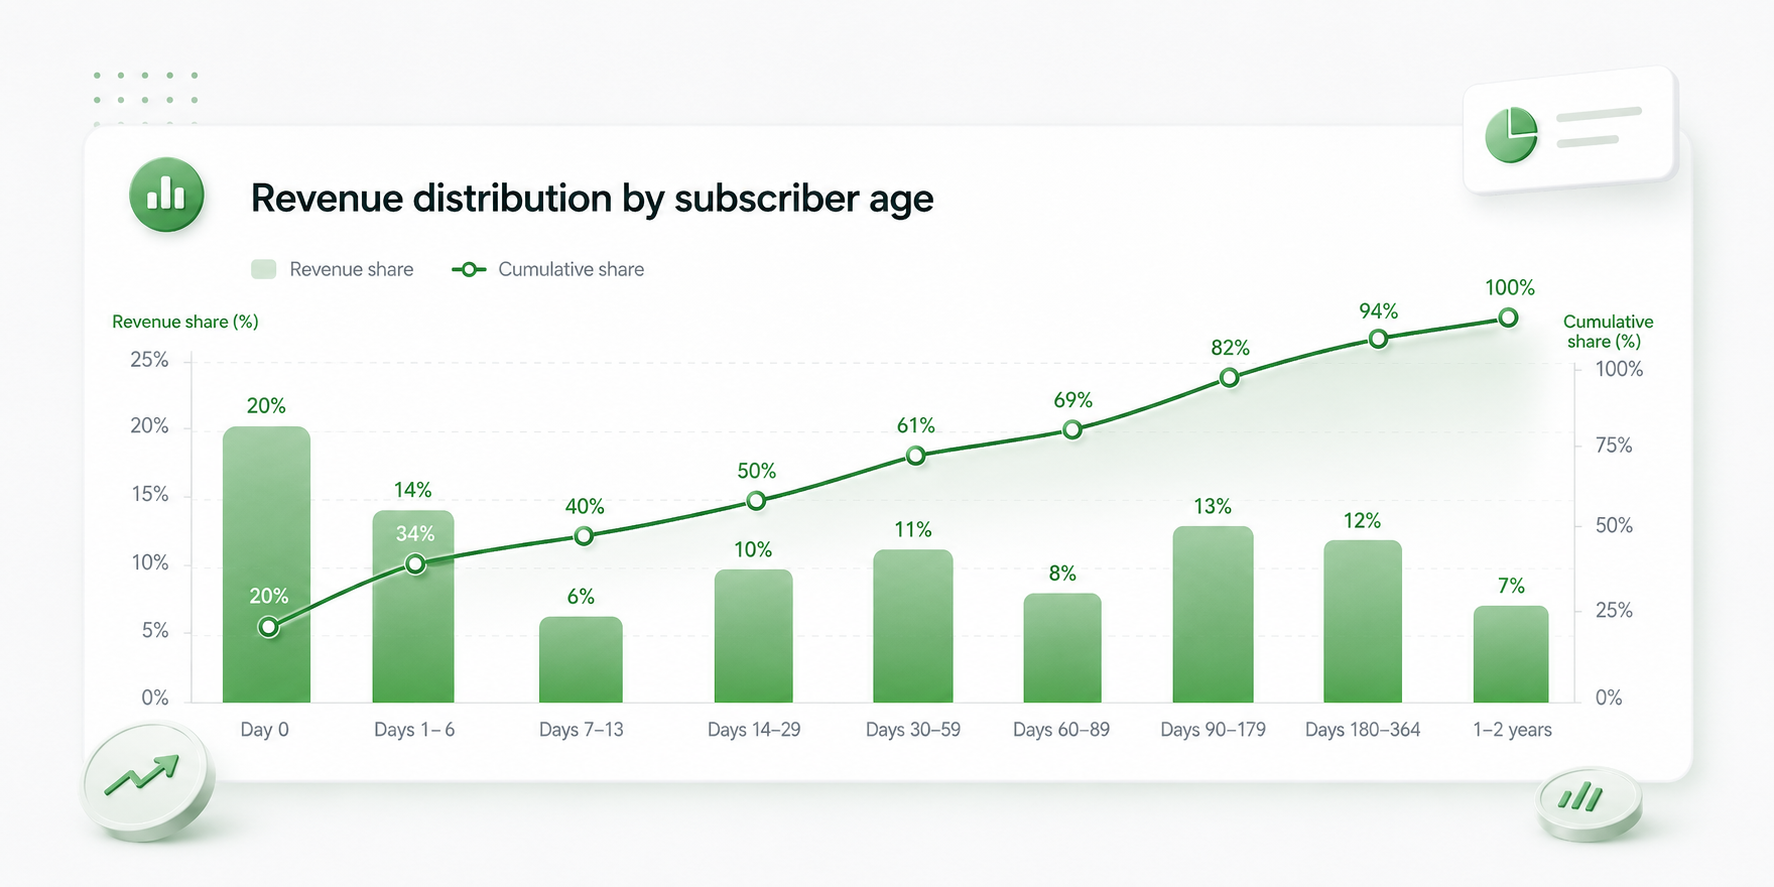
Here's the distribution:
| Subscriber age | Share of total revenue | Cumulative |
|---|---|---|
| Day 0 (subscription day) | ~20% | 20% |
| Days 1 to 6 | ~14% | ~34% |
| Days 7 to 13 | ~6% | ~40% |
| Days 14 to 29 | ~10% | ~50% |
| Days 30 to 59 | ~11% | ~61% |
| Days 60 to 89 | ~8% | ~68% |
| Days 90 to 179 | ~13% | ~81% |
| Days 180 to 364 | ~12% | ~93% |
| 1 to 2 years | ~7% | 100% |
Four things deserve attention.
The day-zero peak is smaller than most agencies assume. About one fifth of a fan's total revenue arrives on the day they subscribed. That's the welcome message, the first PPV, the impulse tip. It's the biggest single day. But it's still only 20%. If your attribution stops here, you're seeing one slice and missing four.
The first month gives you about half. The 30-day window captures roughly 50% of what a fan will spend over their entire relationship with the model. The other 50% is spread out across the remaining 11+ months. If your ROI calculation runs on a 30-day attribution window, you're systematically undercounting traffic value by roughly 2x.
The 90-day to 1-year tail is surprisingly heavy. Days 90 through 364 together produce around 25% of all revenue. This is the part that disappears from most reporting, because by month four nobody is looking at where the fan originally came from. But that money is real, it's attributable, and it's a quarter of what your traffic produces. Killing offers before this window plays out is how you lose your most profitable campaigns.
Year-two fans still pay. About 7% of total revenue comes from fans aged 1-2 years. Small per fan, but pure compounding on top of acquisition cost paid long ago. These are the fans your competitors threw away on day 30.
Practical takeaway: if you're calculating ROI on a 7-day or 30-day window, you're looking at ~40-50% of what your traffic actually produces. The rest is sitting in the next 11 months. That's the part that turns break-even campaigns into clearly profitable ones.
Finding 2: Cross-sales change the math more than most agencies realize
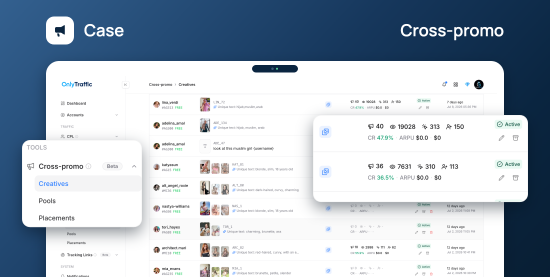
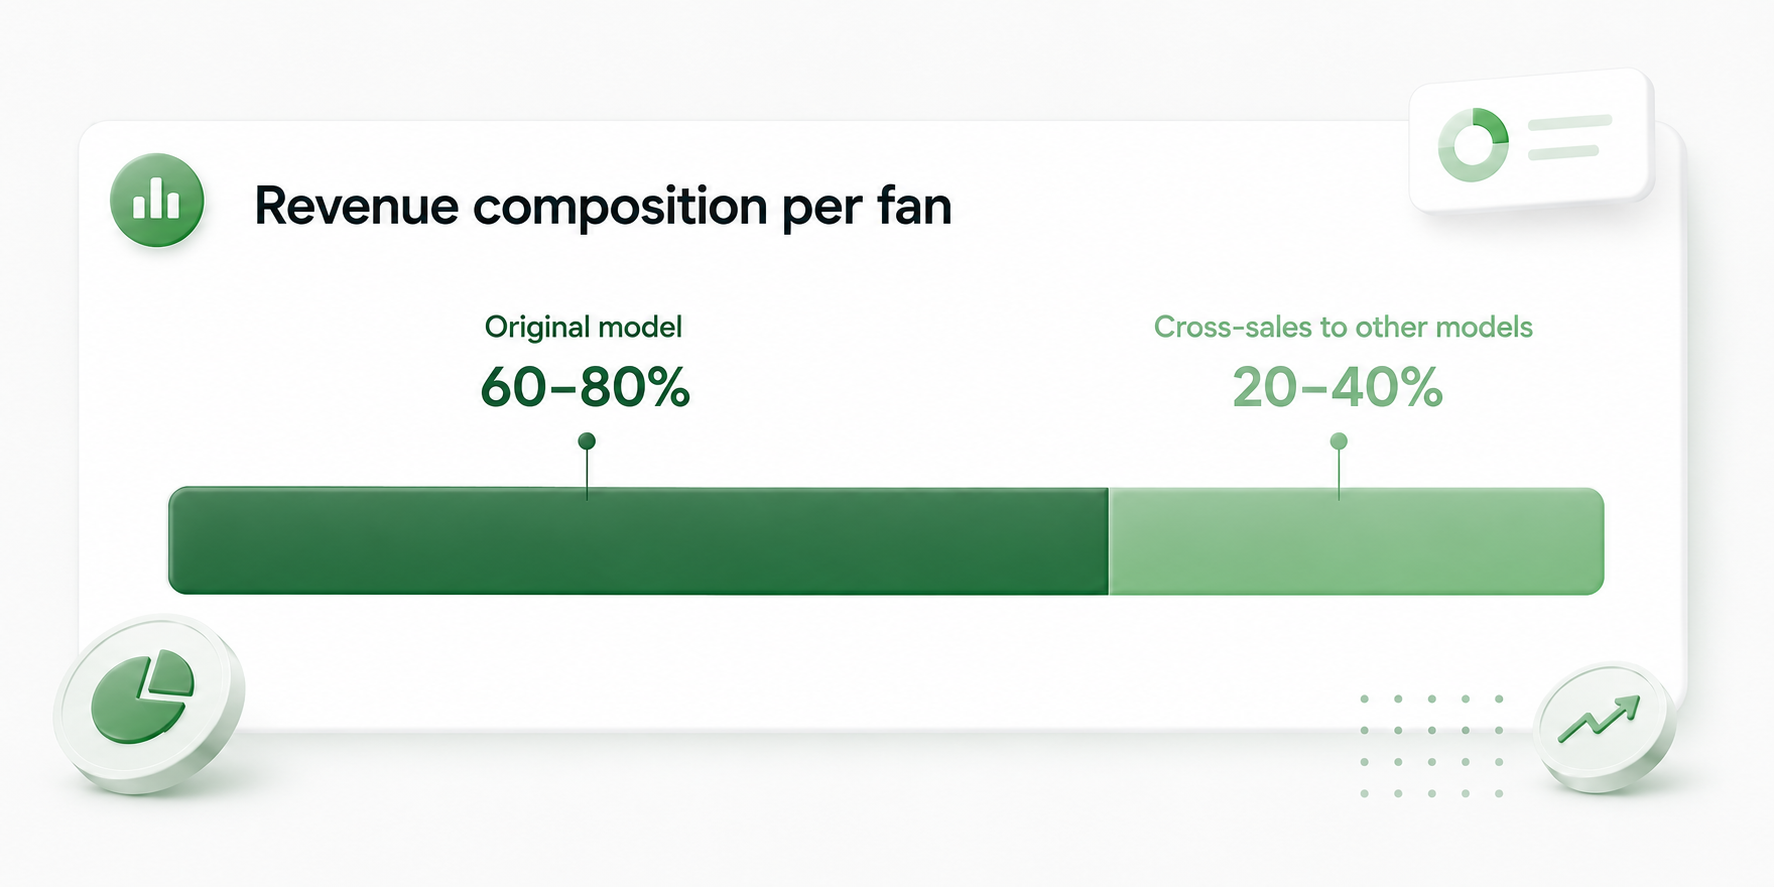
The second finding is about cross-sales: revenue a subscriber generates with creators other than the one they originally subscribed to. This happens when an agency runs a portfolio of models and routes the same fan across multiple accounts through chat introductions, PPV mentions, and GG swaps.
Across our dataset, the average cross-sales share sits in the 20-40% range of total fan revenue. In plain language: for every dollar a fan spends on the model they first subscribed to, they tend to spend another 20-40 cents on other models in the same agency's portfolio.
But the average hides a much wider story. The data shows three distinct patterns depending on how an agency operates:
Low-cross agencies: 5-10%. Agencies that essentially don't work cross-sales actively. The fan stays with the original model, revenue from other accounts is incidental. We see this with single-model setups and with agencies that haven't built the chat infrastructure to redirect attention. They're leaving money on the table without knowing it.
Average agencies: 20-40%. The bulk of the dataset. Agencies that do cross-sales as part of normal operations: chat teams routinely introducing fans to other models, running combined promos, exchanging traffic through fan swaps. This is healthy and reflects mature day-to-day work. The Cardo Crew Agency case study shows exactly how this looks in practice (over 1,500 fans and ~$2,000 in 4 months through structured swap workflows).
Top-performing agencies: up to 70%. A smaller group pushes cross aggressively and has the systems to support it. In their case the original model becomes almost a gateway, and the majority of lifetime revenue from a fan ends up on other accounts in the portfolio. Rare cases. They require real operational maturity, not just intent. But when they work, they unlock economics most agencies don't realize are possible.
Now stack the two findings on top of each other. An agency calculating returns only on the original model is missing 20-40% of the revenue the traffic actually produced. An agency that hasn't built cross into their workflow at all is missing all of it. And both of them are still only seeing the first 30 days. You can see how the gap between "what the dashboard says" and "what the traffic actually did" gets large fast.
What this means for your dashboard
Combine both findings and the picture gets sharper.
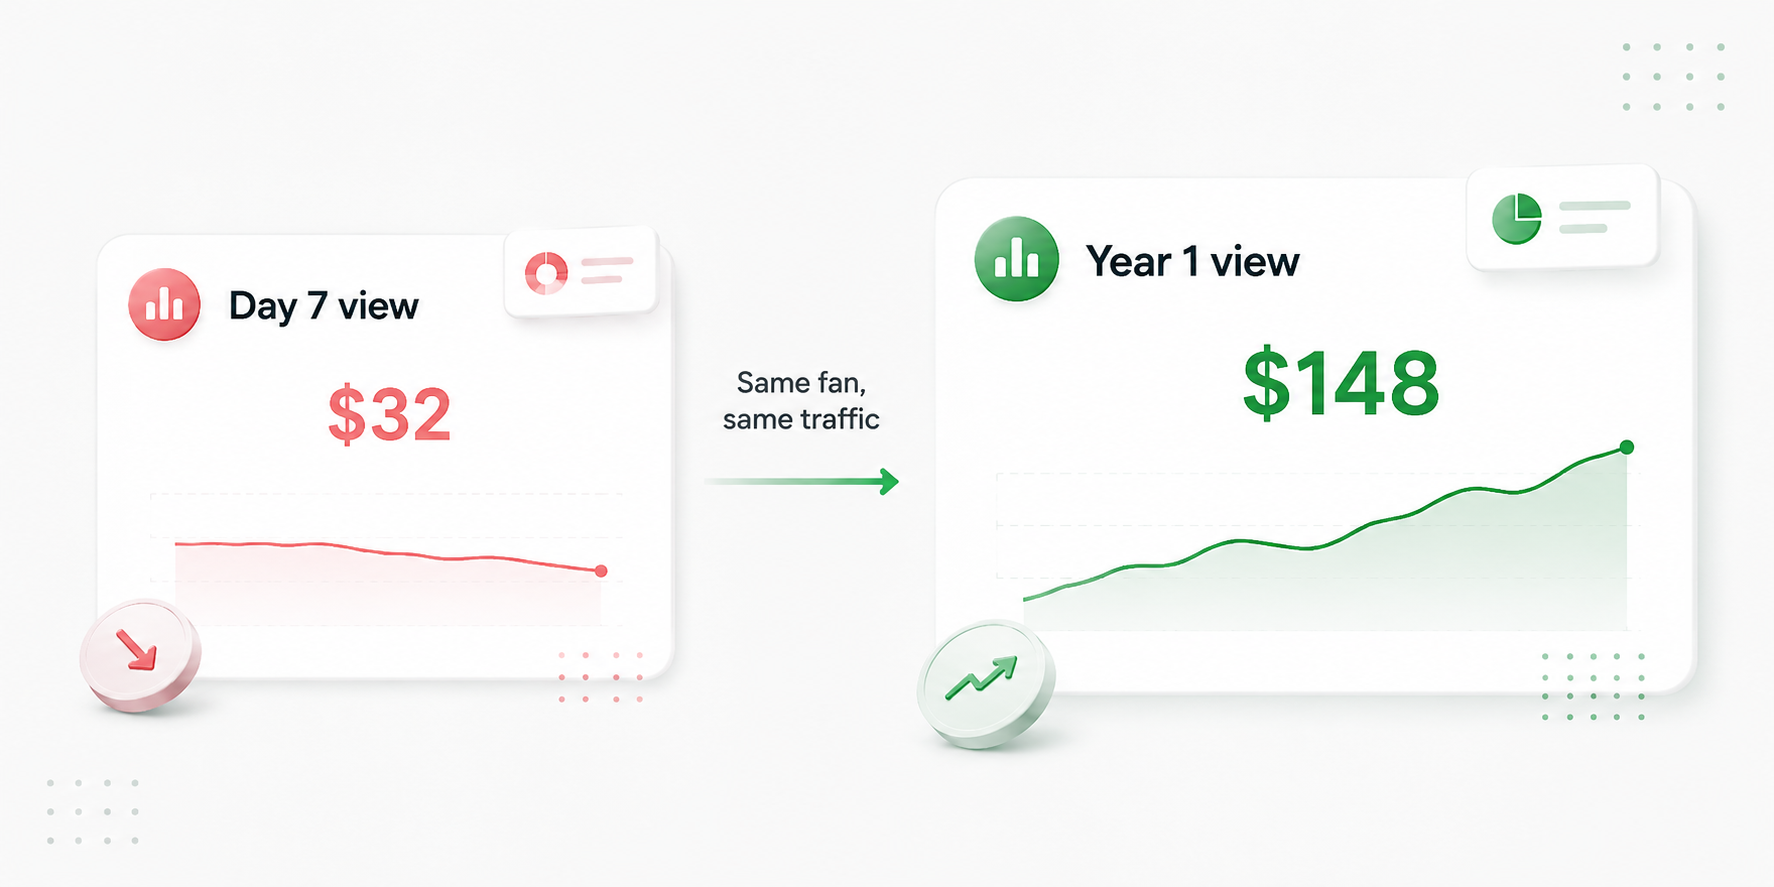
A fan who looks unprofitable in the first week is often profitable by month two. A fan who looks marginal at the original model is often strongly profitable once cross is counted. A campaign that breaks even at the 30-day mark is, on average, returning 2-3x the spend when measured across the full subscriber lifetime, depending on how active the agency is with cross.
Looking at "current ROI" in isolation is misleading. The number you see at month one is the floor, not the ceiling. The forecasted return at 12 or 24 months is what actually reflects the value of the traffic.
This is exactly why the OnlyTraffic Studio dashboard now shows a forecasted ROMI 2y next to current ROMI on every offer, cohort, and partner. The forecast isn't a guess. It's the patterns above applied to your specific cohorts. If a fan looks marginal today and your forecast says +120% in 12 months, the data says wait. If it says -55%, pull the plug now and save the spend.
Practical implications
For agencies buying traffic. Stop evaluating offers on a 7-day or 30-day basis only. Your traffic provider, if they have proper cohort analytics, should be showing you a forecasted lifetime value next to current return. If they aren't, you're making decisions on incomplete information. Pausing campaigns on day-30 numbers is how you kill the offers that would have become your best performers. (Broader breakdown of OnlyFans traffic sources and what actually works in How to Promote OnlyFans.)
For agencies thinking about cross-sales. If your current cross share is below 20%, there's meaningful upside without acquiring a single new fan. Building out cross workflows, training chat teams to introduce other models, setting up GG swap partnerships. These are some of the highest-ROI activities available because the acquisition cost has already been paid. We've watched agencies move from ~10% to ~35% cross in a quarter just by getting the chat workflow right.
For marketers selling traffic. When you negotiate CPL or CPC rates, the agency on the other side is often pricing based on day-30 economics. If your traffic produces fans who stick around (and the data says most do), you're systematically underpriced. Quality traffic compounds, and right now the agency captures most of that compounding. There's room in that conversation.
For pricing fans correctly. Bad fan-counting destroys ROI math regardless of how good your LTV is. If you're buying or selling GG promos, understanding why traditional FTL counts overstate fan volume is essential. See Why FTL Calculation on OnlyFans Misleads You.
FAQ
How long does it take for an OnlyFans subscriber to pay back acquisition cost?
Depends on acquisition cost, model pricing, and chat performance. Directionally: the first 30 days produce about half of a fan's total revenue, and most healthy CPL campaigns reach break-even in the first 1-3 months. Profit accumulates over the rest of the lifetime.
What is a good cross-sales percentage for an OnlyFans agency?
20-40% is solid and reflects normal cross operations. Below 10% suggests cross infrastructure is either missing or underused. Above 50% is unusual and typically reflects either a portfolio with strong synergy between models or a very mature operation.
Does subscriber LTV plateau, or does it keep growing?
It decelerates but doesn't stop. The first 30 days are densest. Days 30-365 still produce roughly half of total revenue. Year-two fans still contribute around 7%. After two years the signal gets harder to isolate cleanly, but it isn't zero.
Why does day 7-13 dip in the data?
The day-zero impulse buys are done, longer-term engagement hasn't stabilized. It's a transitional bucket where fans without strong engagement drop off and fans who stay are still warming up. The curve recovers from day 14.
Can I apply these numbers to my own agency directly?
The percentages are a reference frame, not a forecast for your specific situation. Use them to question your attribution window (is 30 days really enough?), to benchmark your cross share (am I at 10% or 30%?), and to put context around traffic value. For exact numbers, the only reliable source is your own cohorts.
Does this apply to paid OnlyFans pages too?
This dataset covers free pages only. On paid pages the day-zero peak typically represents the subscription fee itself, and the LTV curve looks different because the entry barrier filters fans differently. The general principle (long-tail revenue matters, cross adds a meaningful layer) still applies, but the exact shape will not match.
Why are you publishing this?
Because most of our agency partners are smart operators making decisions on incomplete data, and the gap costs them money. Which costs us partners. The more agencies understand the real shape of subscriber economics on OnlyFans, the better decisions they make, the longer they stay, and the more healthy the marketplace becomes. We'd rather lose the information asymmetry than lose the partner.
Bottom line
Two million transactions on free OnlyFans pages tell a consistent story. Subscriber revenue is heavily back-loaded compared to how most agencies measure it. Cross-sales add another layer most short-term ROI calculations ignore entirely. Together, the real economic value of acquired traffic is typically 2-3x what a day-30 view shows.
If you work with OnlyTraffic, the forecasted ROMI in your dashboard is built on this exact analysis applied to your specific cohorts. If a fan looks marginal today, the data usually says wait. If a partner looks underperforming, look at their forecast before turning them off.
And if you're buying traffic and not seeing forecasted LTV in your reporting (wherever you buy it), you're making decisions on roughly half the picture.
Published by the OnlyTraffic Analytics Team. Based on aggregated transaction data from OnlyTraffic agency partners on free OnlyFans pages who consented to research inclusion. Last reviewed: May 2026.
Want to see this kind of cohort analysis on your own traffic? Open OnlyTraffic Studio. LTV forecasting and cross-sales attribution come built-in.